One. Core Finding and Direction: The High-Volume Surge Lacks Active-Buying Confirmation
Data basis: As of 2026-09-04 08:55 UTC+8, the analysis covers the latest 24 hours and compares them with up to 180 historical 24-hour periods aligned to the same cutoff time. Core finding: BTC gained 5.08% on heavier volume, yet the cumulative active buy-sell slope fell to -226 BTC, showing a divergence between the price surge and immediate demand. This matters more than the gain alone because a rally without sustained active buying is more vulnerable to reversals near the highs. Historical comparison: The current gain is +5.08%, versus a historical average of +0.09%; among 180 comparable periods, only about 3 were higher, making this a clear market dislocation. Scope check: All 13 quality checks passed. No unit, frequency, or magnitude inconsistency was found, and there were no scope-anomaly candidates that needed to be excluded from the directional assessment. Directional view: Bearish. The composite signal agrees with active selling and weak short-term momentum, but conflicts with the sharp price rise and warmer funding backdrop. It is therefore conditional and does not mean the rally has already ended. Assessment horizon: The next 24 hours. Confirmation condition: Price fails to hold around 80,936.90 USDT while active buying minus active selling remains negative. Invalidation condition: Price breaks back above 82,282.80 USDT with sustained active buying while volume remains near its current active level.
Two. Key Market Data: A High-Volume Surge Raises Pullback Sensitivity
Over the past 24 hours, price rose rapidly from its low and closed at 80,936.90 USDT, up +5.08%, within a range of 76,927.30 to 82,282.80 USDT. Volume reached 245,795 BTC, compared with a historical average of 154,918 BTC; among 180 comparable periods, only about 16 were higher. Rising price and volume show genuine repricing rather than a low-volume drift. However, price has already retreated from the intraday high, so the key question is no longer whether it rallied, but whether heavy turnover can become closing demand. If volume stays elevated while price repeatedly fails to reclaim 82,282.80 USDT, overhead turnover may become short-term supply. A high-volume breakout would instead require the bearish view to be downgraded.
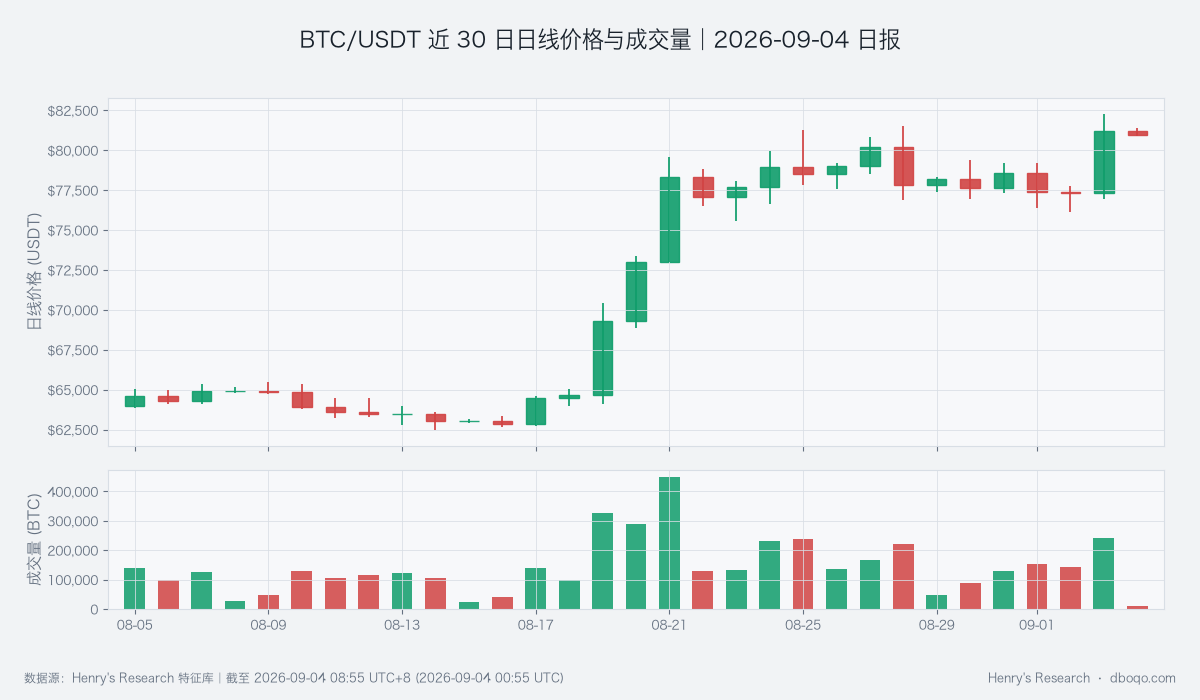
BTC/USDT daily price and volume over the past 30 days: watch whether the high-volume rise develops into sustained demand
Three. Price Action and Trend: Short-Term Momentum Still Lags the Gain
The short-term MACD histogram is -18.90 USDT, versus a historical average of +1.40 USDT, lower than about 84% of comparable periods. MACD helps show whether the pace of price movement is strengthening; its negative reading means the rapid rise has not yet become persistent momentum. Meanwhile, the short-term moving-average spread is only -2.00 USDT, close to its normal historical range and not yet showing clear trend expansion. If the histogram turns positive and price holds above 80,936.90 USDT, the surge could develop into a trend. If momentum remains weak, a volatile consolidation is more likely first.
Four. Price-Volume Structure and Price Range: Active Selling Restrains the Recovery
The cumulative active buy-sell slope is -226 BTC, versus a historical average of -13 BTC; among 180 comparable periods, only about 8 were as low or lower. This measure shows whether trades lean toward active buying or active selling. Its negative reading means aggressive demand remains weak even as total turnover is high. Price is at 0.05 within its recent range, compared with a historical average of 0.51, with only about 4 comparable periods as low or lower, showing that the short-term structure remains near the bottom of the range. Together, these readings support the bearish view, but they also define a clear counter-signal: if active buying minus active selling turns positive and lifts price away from the range floor, the structural pressure would be invalidated.
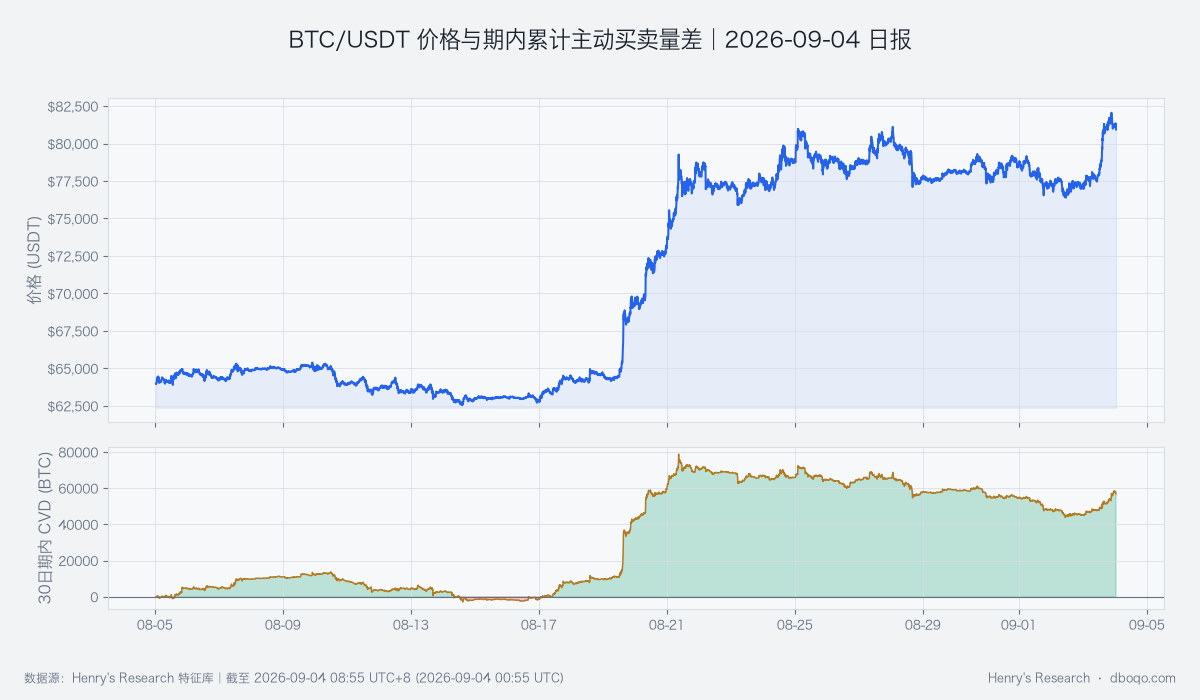
BTC/USDT price and cumulative active buy-sell volume over the past 30 days: test whether the advance gains confirmation from active demand
Five. Derivatives Shift: Funding Is Elevated While Participation Has Not Expanded
The average funding rate over the past 24 hours is +0.007402%, versus a historical average of +0.002553%, higher than about 87% of comparable periods. Funding reflects the cost paid between the two sides of the perpetual market; an elevated reading shows that bullish demand is already paying more. Yet overall contract participation changed by -0.47%, compared with a historical average of +0.19%, and remains within its normal range rather than expanding in tandem. The combination points to optimistic sentiment without broad incremental confirmation. If funding rises further while participation and price weaken, pullback pressure would increase. If participation recovers moderately alongside a price breakout, the crowding risk could be absorbed.
Six. Cross-Market and Funding Conditions: A Warmer Backdrop Has Not Offset ETF Outflows
BTC's cross-market funding temperature is warm. In plain terms, a weaker dollar, relatively calm volatility expectations, and improving longer-term stablecoin supply make the broader environment less restrictive for risk assets. The 30-day stablecoin supply growth rate is +0.75%, compared with a historical average of -0.11%, higher than about 68% of comparable periods. However, ETFs still recorded a net outflow of USD 1.21 hundred million over the past 5 days, versus a historical average net outflow of USD 0.32 hundred million. The backdrop is therefore warmer at the perimeter but still short of direct inflows. It can cushion downside pressure but cannot by itself prove that price will continue higher. The next check is whether ETF flows turn positive and whether the warmer environment actually brings back active buying.
Seven. Composite Signal and Scenario Test: The Bearish View Still Needs Price Confirmation
The composite signal is bearish. It agrees with the cumulative active buy-sell slope, short-term momentum, and range position, but conflicts with the +5.08% gain, high volume, and warm funding temperature. The base case is that the market consolidates over the next 24 hours to digest the surge. If the area around 80,936.90 USDT fails and active selling persists, the bearish view is confirmed; the first downside check is whether demand emerges around 76,927.30 USDT. The reverse scenario is a high-volume close above 82,282.80 USDT accompanied by a turn to active buying. That would confirm the trading structure behind the rally and directly invalidate the current view.
Eight. Risk Notice
Both the current gain and trading volume are well away from normal levels, increasing short-term price elasticity and false-breakout risk. Cross-market factors describe conditional changes under a consistent statistical framework and do not establish deterministic causality. ETF, stablecoin, dollar, and volatility signals may also diverge. The assessment should therefore depend on whether price holds the key area and whether active buying returns, rather than treating any single indicator as a certain directional call.
Disclaimer: This report was prepared by dboqo using market data available as of 2026-09-04 08:55 UTC+8. Cryptocurrency markets are highly volatile. This report provides an objective analysis of market conditions only and does not constitute investment advice. Investors must assess risks independently and make prudent decisions.