One. Core Finding and Direction: Contracting Activity and Stronger Absorption Create a Range-Bound Tug of War
Data context: Data are current through 2026-09-05 09:10 UTC+8. The current observation window covers the latest 24 hours, while the historical comparison uses 180 prior 24-hour samples aligned to the same cutoff.
Core finding: BTC fell 1.62% over the latest 24 hours, yet the cumulative slope of active buying minus active selling rose to +186 BTC, indicating that buyers have started absorbing supply during the decline. At the same time, price-volume activity fell to a rarely seen low, so broader participation has not yet confirmed that the new demand can persist. The central issue is not the one-day decline itself, but whether localized absorption can broaden into sustained trading activity.
Historical comparison: The current price-volume activity ratio is 0.96, below its historical average of 1.03. Among 180 comparable periods, only about 1 was equally low or lower. This means the contraction in participation is unusually severe, making any rebound more vulnerable to reversal and reducing confidence in a near-term directional call.
Scope check: All 13 quality checks passed. No unit, frequency, or magnitude issue was found, and there were no scope-anomaly candidates requiring exclusion. The contraction in price-volume activity is therefore treated as a market event rather than a data error.
Direction: The baseline view for the next 24 hours is range-bound. Weak price action and insufficient activity are headwinds, while active buying and a warm capital backdrop are counterevidence. The evidence is not yet strong enough to confirm a one-way move.
Horizon: The next 24 hours. Conditions for the view to hold: Price stabilizes after the decline, active buying minus active selling stays positive, and price-volume activity recovers from its rare low. Invalidation conditions: Absorption weakens as price continues lower, or activity recovers but is driven mainly by selling. Either outcome would overturn the range-bound view.
Two. Key Market Data: The Decline Is Weak but Not an Extreme Dislocation
BTC fell 1.62% over 24 hours, compared with an average gain of 0.12% across 180 comparable periods; the current result is lower than about 83% of those periods. The gap confirms genuine price pressure, but it is not rare enough to dictate direction on its own. The next test is whether the decline expands as activity returns: stronger trading without stabilization would reinforce the bearish case, while low-volume stabilization would remain consistent with consolidation.
Three. Price Action and Trend: The Decline Still Needs Expanding Activity for Confirmation
Weak price action alongside contracting price-volume activity suggests limited-participation repricing, rather than a broad selloff that has already been confirmed. Low activity proves neither that a bottom is in place nor that the decline will naturally continue; it only shows that price discovery is less efficient. If price keeps falling while the activity ratio remains near 0.96, the directional signal should still be discounted. If activity returns to normal while price weakens in tandem, the range-bound view would begin to tilt bearish.
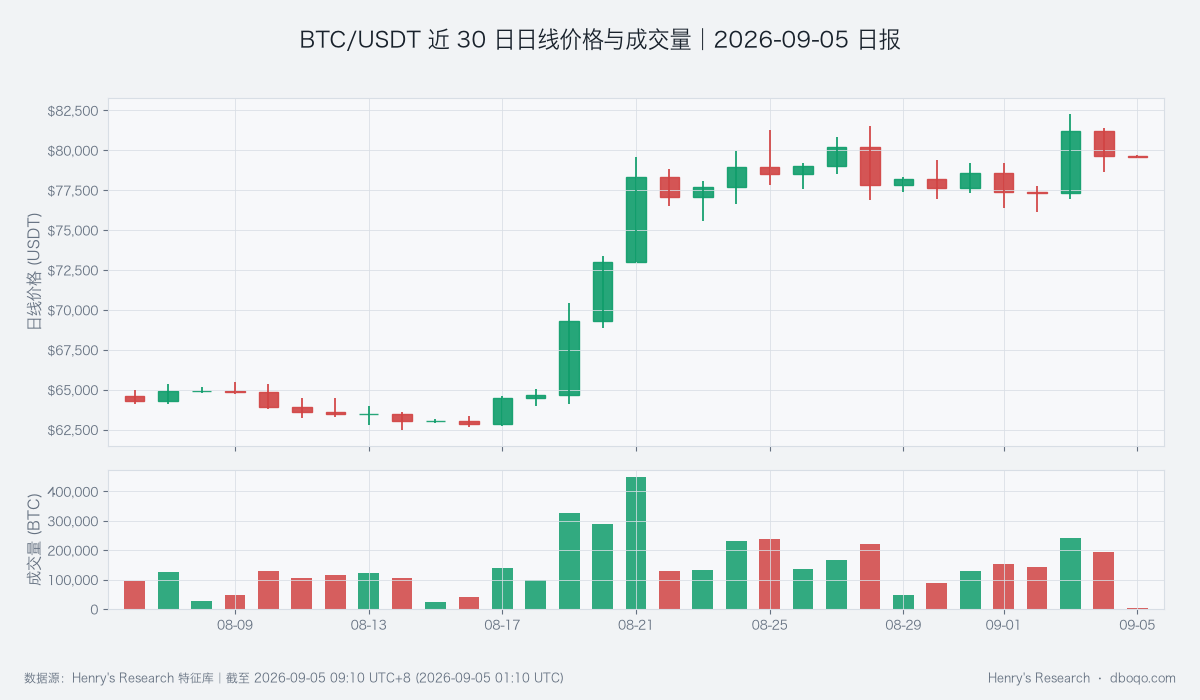
BTC/USDT daily price and volume over the latest 30 days: used to assess whether the decline is confirmed by expanding activity
Four. Price-Volume Structure and Price Range: Strong Active Absorption Lacks Broad Confirmation
The cumulative slope of active buying minus active selling is +186 BTC, versus a historical average of -19 BTC; only about 12 of 180 comparable periods were higher. This measure tracks the direction of aggressive trading, and the current reading shows unusually strong buyer absorption during the decline, directly challenging the weak price signal. Yet the leading anomaly remains the rare contraction in overall price-volume activity, so localized absorption has not become broad participation. The next test is whether positive absorption persists and lifts activity away from its low; otherwise, price may continue probing within a narrow range.
Five. Derivatives: Rising Participation Amplifies Two-Way Volatility
Contract participation increased 4.30% over the latest 24 hours, well above its historical average of 0.19%; only about 14 of 180 comparable periods were higher. Growing participation while price falls indicates that disagreement is accumulating rather than market interest disappearing. That can accelerate either a breakout or a rebound, but it does not determine direction by itself. The funding rate remains positive and its recent evolution is visible in the chart, so the next question is whether participation eases as price stabilizes or expands further during another decline.
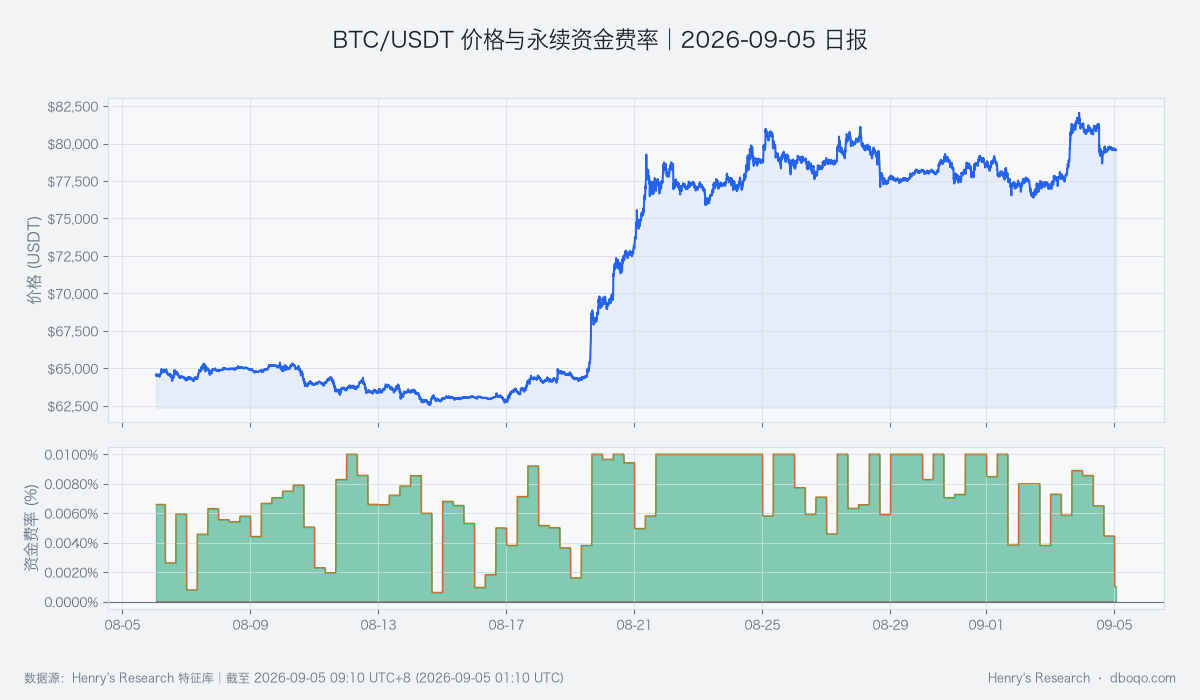
BTC/USDT price and perpetual funding rate over the latest 30 days: used to judge whether contract demand is amplifying disagreement
Six. Cross-Market and Capital Conditions: A Warm Backdrop Cushions the Decline
BTC cross-market capital conditions are warm. ETFs recorded a net inflow of 8.12 hundred-million U.S. dollars over the latest 5 days, while stablecoin supply growth stayed positive over both 7-day and 30-day windows. A softer dollar and a VIX at a rarely low level also create a more supportive risk backdrop. These factors indicate a cushion, not a guarantee that capital must flow into BTC. With price still declining and price-volume activity at a rare low, the warm backdrop is counterevidence rather than trend confirmation. The next question is whether easier conditions translate into sustained trading and price stabilization.
Seven. Composite Signal and Scenario Tests: Offsetting Evidence Keeps the Outlook Range-Bound
The composite signal is range-bound, matching a public-market picture of weak price action, strong absorption, insufficient overall activity, and warm capital conditions. Active buying and the capital backdrop support stabilization, but neither has aligned with a broad expansion in price-volume activity, so localized demand cannot yet justify a bullish call. The baseline scenario is continued two-way consolidation over the next 24 hours. Improving absorption and activity together would shift the view bullish; reversing absorption alongside selling-led activity would overturn the current view and shift it bearish.
Eight. Risk Notice: Thin Activity Can Magnify Short-Lived Shocks
When activity is low, relatively small order flows can cause outsized price swings. Contract participation is also at a rarely high level, increasing the risk of rapid reversals. ETFs, stablecoins, the dollar, and VIX update at different frequencies and can only frame the capital backdrop conditionally. Readers should watch whether active trading direction, price-volume activity, and price begin to confirm one another, while remaining alert to macro surprises, sudden liquidity loss, and changes in the daily quantity proxy for the covered BTC perpetual markets.
Disclaimer: This report was prepared by dboqo using market data through 2026-09-05 09:10 UTC+8. Cryptocurrency markets are highly volatile. This report is an objective analysis of market conditions only and does not constitute investment advice. Investors should assess risks independently and make prudent decisions.