I. Core findings and direction: The rally has trend support but needs stronger participation
Core finding: BTC advanced over the week, yet the key development was a divergence between price and volume: relative trading activity was unusually low, while aggressive net buying was weak at the end of the period. The price trend and ETF inflows still provide support. The question for next week is whether sustained trading demand can validate the advance, rather than whether a single rebound can be extrapolated into an accelerating rally.
Historical comparison: Relative trading activity averaged 1.02 this week against a historical mean of 1.04. Among 104 comparable weeks, only about 1 was as low or lower, an unusually weak reading. This measures participation relative to each period's recent norm; it does not mean total volume reached an equally rare historical low. Next week, the focus is whether this measure of participation improves.
Data context: The observation window is 2026-08-31 00:00 to 2026-09-07 00:00 UTC, with a cutoff of 2026-09-06 23:55 UTC and 2,016 bars of 5-minute market data. Historical comparisons use 104 complete calendar weeks. The weekly price change runs from the weekly open to the weekly close. Daily and rolling fund-flow measures are interpreted at their respective observation frequencies.
Measurement checks: No unit, frequency or scale anomalies requiring exclusion from the directional assessment were identified. The unusually weak participation reading is a statistical market development. Liquidations are checked at their native daily frequency, while rolling fund-flow observations are not repeatedly accumulated across days. Lower-frequency information is reported with a lag; its displayed cutoff does not establish that fresh inflows have just occurred.
Directional assessment: Bullish, with incomplete confirmation from volume. Assessment horizon: The next calendar week, 2026-09-07 to 2026-09-14 UTC. Conditions for the view: Price maintains the recovery established during the week, aggressive buying improves and funding support does not materially reverse. Invalidation conditions: Aggressive net selling keeps increasing, price breaks the recovery structure and the capital backdrop weakens. That combination would invalidate the current bullish assessment.
II. Historical comparison and key changes: Rarely weak relative activity does not mean a collapse in overall trading
Total weekly volume was 966,607 BTC, below the historical average of 1,259,519 BTC and lower than approximately 66% of comparable weeks. This supports the view that volume confirmation is incomplete, but it is much less unusual than the relative activity reading. The comparisons answer different questions: total volume describes the scale of trading across the week, while relative activity compares each observation with its recent norm. If only a handful of sessions show stronger volume next week while the rest remain quiet, that would still fall short of broad confirmation.
A second counterargument comes from aggressive net buying at the end of the period. The measure gauges the strength of aggressive buying relative to its own normal range. It stood at -1.41 against a historical average of +0.16; among 104 comparable weeks, only about 2 were as low or lower. This indicates weak buying initiative at the end of the week, not seller dominance at every point throughout it. Its relevance is whether rising prices can attract subsequent demand. Next week, buying needs to recover persistently rather than improve only briefly during rebounds.
III. Price action and trend: The midweek advance preserved gains but has yet to confirm a breakout
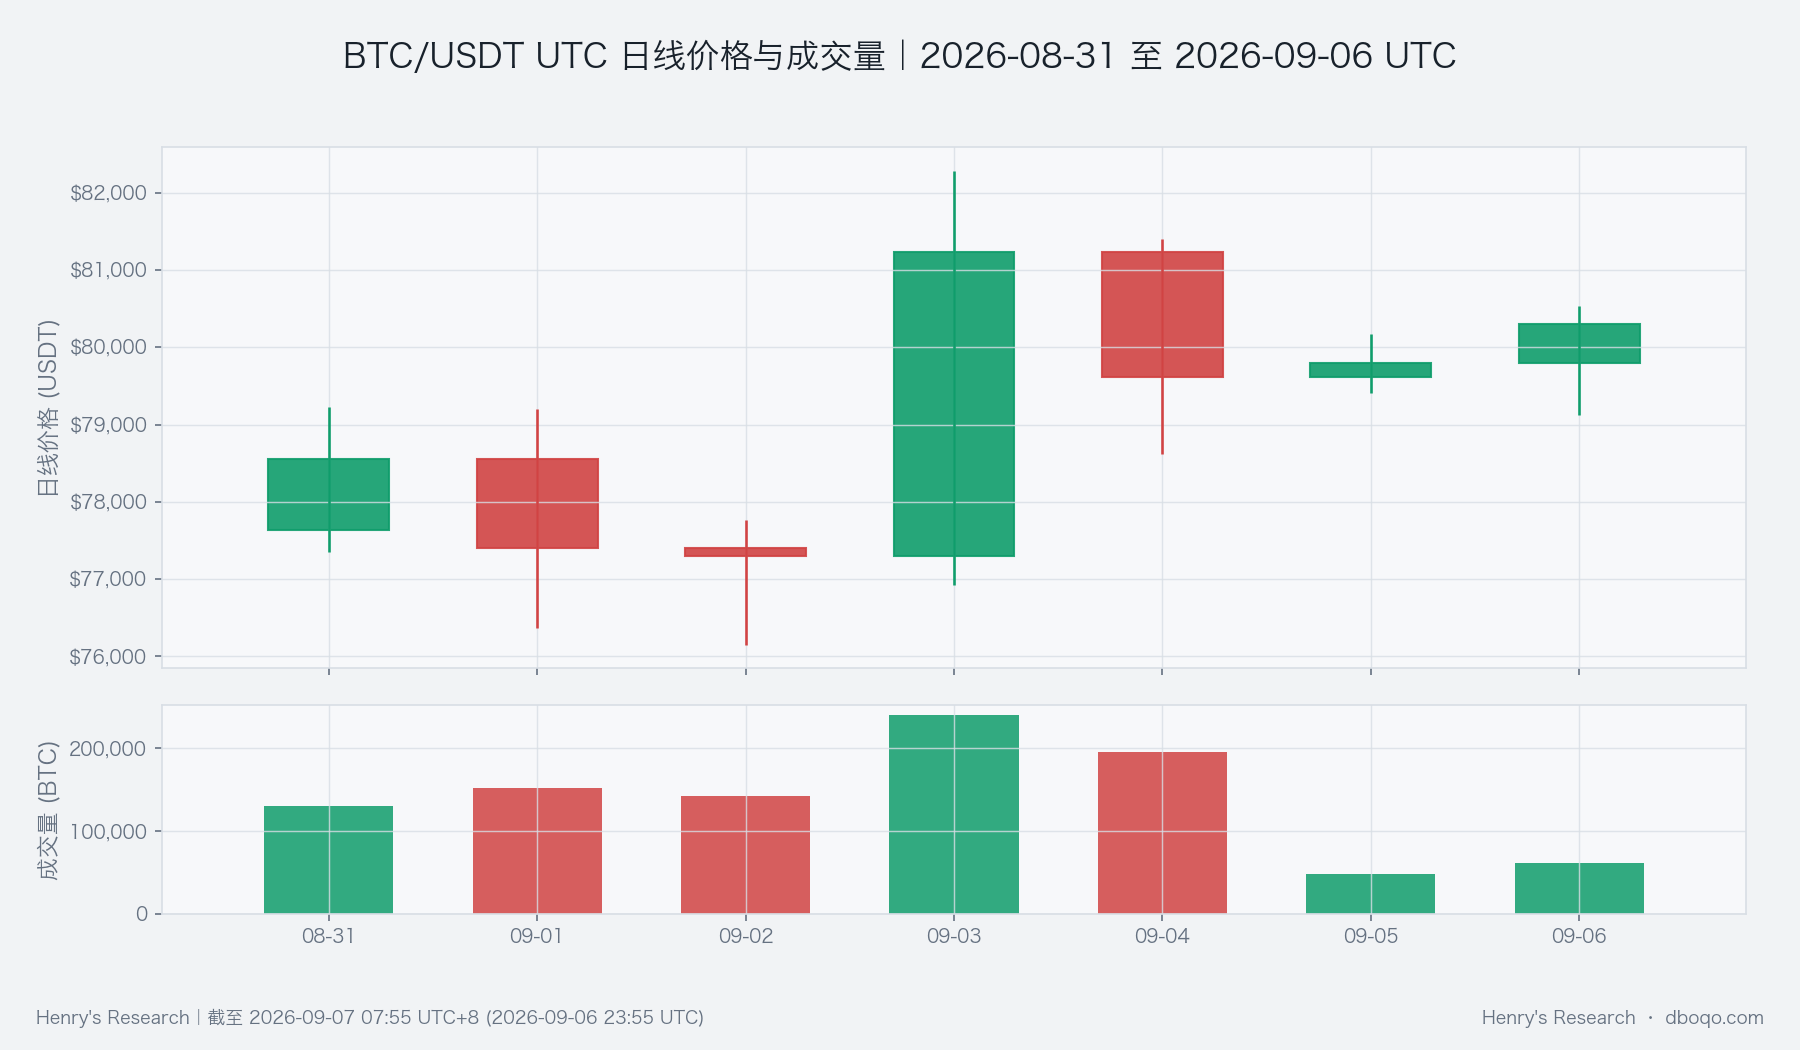
The weekly close was 80,301.10 USDT, up 3.43% from the weekly open. Price initially declined, rallied sharply in the middle of the week, then surrendered part of the advance before a modest weekend recovery. The daily price and volume chart shows that the main impulse came from the midweek rally on stronger volume, while weekend gains attracted substantially less trading. Retaining the weekly gain supports the bullish view, but another challenge to the week's high needs renewed participation. A positive close is not itself a confirmed breakout.
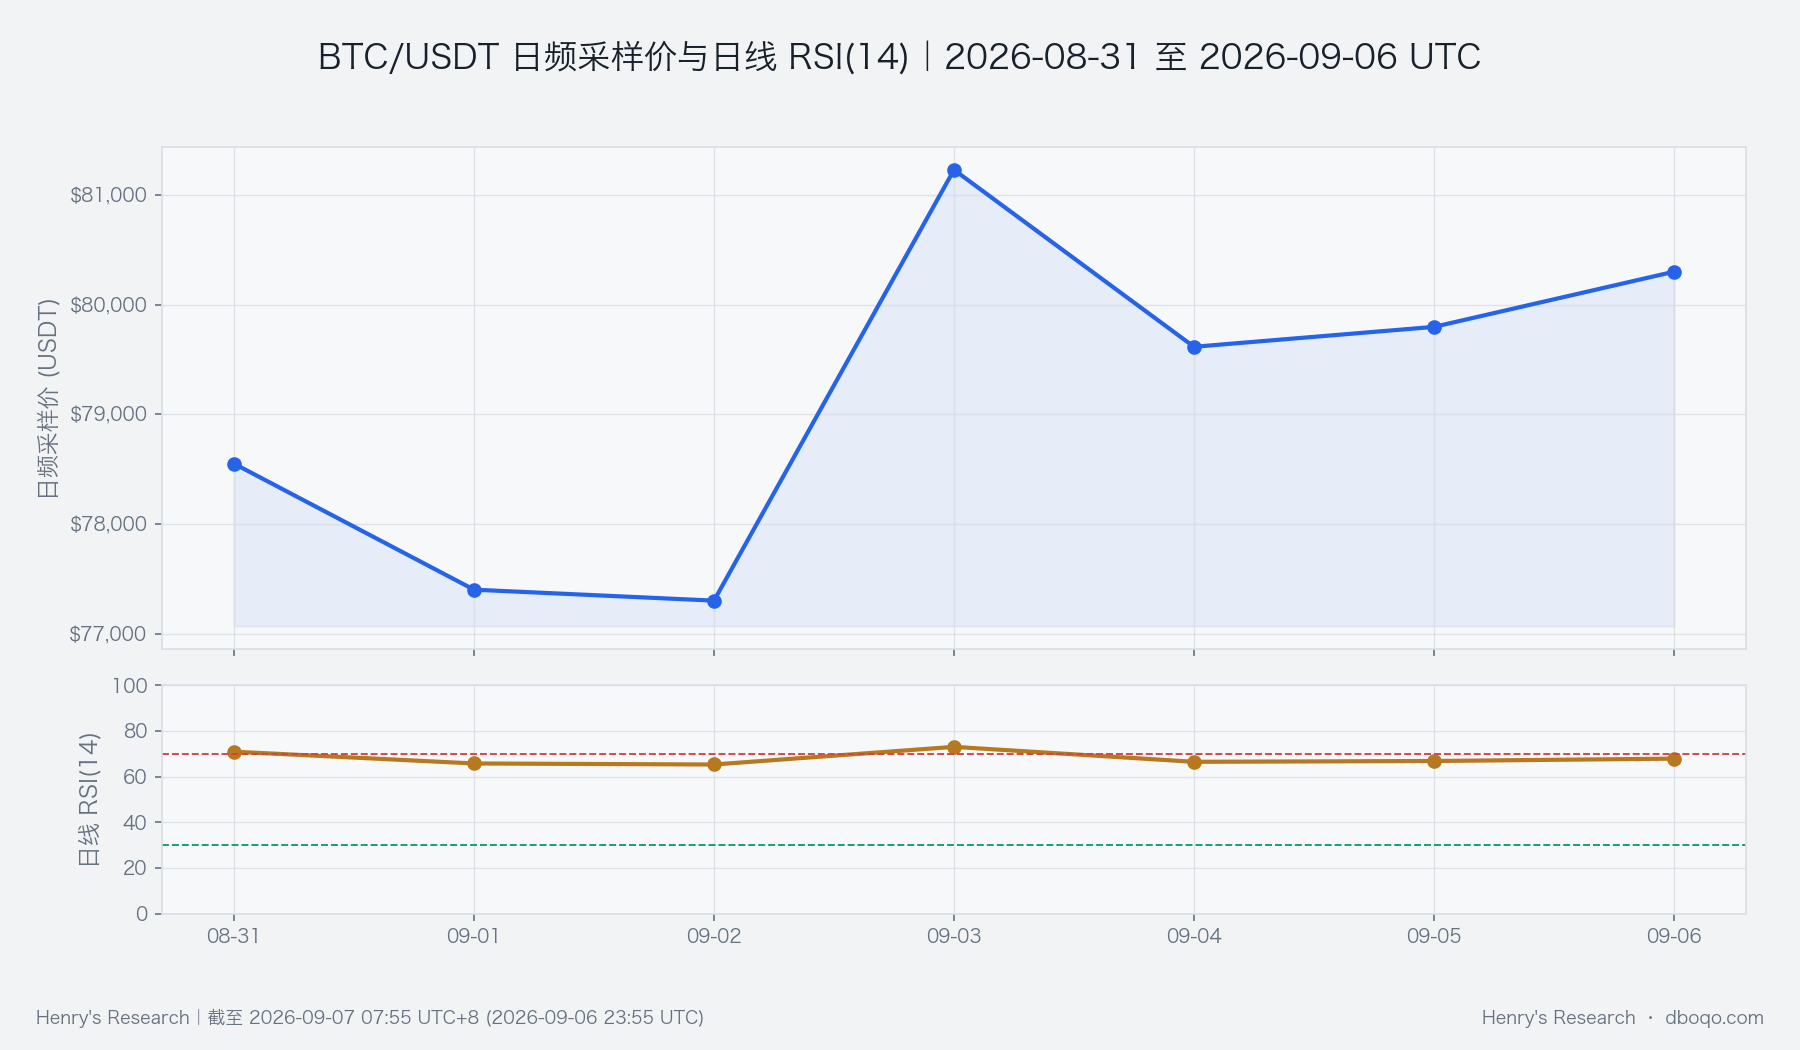
The short-term moving-average spread was +252.38 USDT against a historical mean of +7.65 USDT, higher than approximately 81% of comparable weeks. This indicates a positive short-term price alignment, consistent with the weekly recovery. It is a short-term reading at the cutoff, not proof that the trend was strong throughout the week. In the chart below, daily RSI measures the relative strength of upward and downward price momentum. It eased after the rally, suggesting momentum did not keep accelerating. If price rises again next week while daily momentum continues to weaken, the trend evidence will need reassessment.
IV. Price-volume structure and trading range: Cumulative selling pressure remains a challenge to an upside break
Aggressive buying minus aggressive selling subtracts seller-initiated volume from buyer-initiated volume. Its cumulative value over the period helps assess whether demand accompanies changes in price. The chart shows the cumulative balance briefly turning positive during the midweek recovery, then falling below zero again even as price remained above its level at the start of the week. Together with weak relative activity, this divergence shows that rising prices do not automatically imply dominant aggressive demand across the entire observation period.
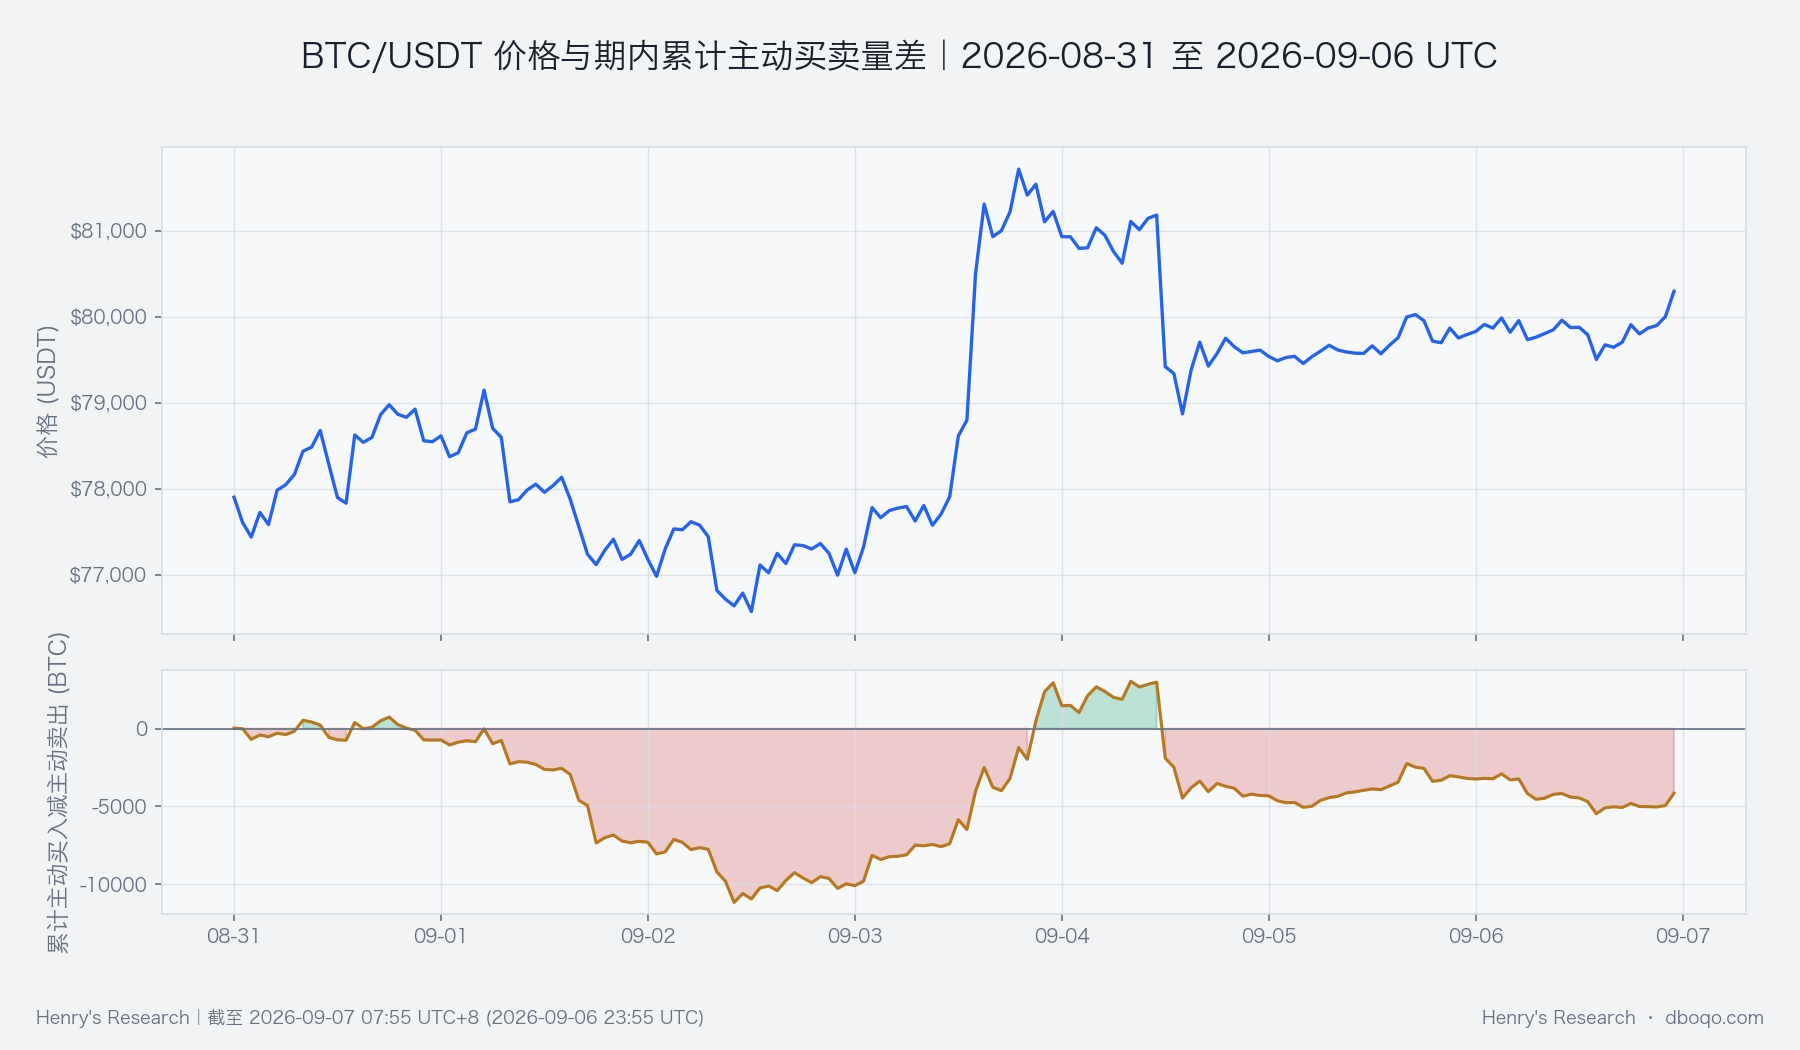
The week's high and low were 82,282.80 and 76,151.90 USDT. The upper boundary helps assess whether a breakout attracts sustained buying, while the lower boundary helps identify a fundamental breakdown of the week's recovery. These are observed price boundaries, not support or resistance levels guaranteed to produce a reaction. If price approaches the upper boundary next week while aggressive net selling grows, confidence in a lasting breakout should fall. Better buying and higher price lows would instead help reduce the divergence.
V. Derivatives: Pricing shows no broad overheating but does not resolve the participation question
The futures basis measures the premium or discount of futures to spot. Its weekly average was -0.05%, compared with a historical mean of -0.04%, close to the middle of the historical range. The small discount indicates that derivatives did not provide a strong premium signal alongside the advance. Yet the reading is not unusual, and its negative sign alone cannot establish a bearish outcome. More informative next week will be whether the basis improves alongside aggressive buying and price, or whether all weaken together.
Derivatives therefore provide a cross-check on the quality of the rally, rather than grounds for calling this a crowded market. Funding rates, contract activity and liquidations have different observation frequencies; intraday readings should not be confused with weekly averages. Liquidations can accompany either rising or falling prices. Without sufficient evidence, they cannot establish that a particular type of trader caused the move.
VI. Cross-market conditions and capital: ETF support leaves the broader funding backdrop neutral
Measured in hundreds of millions of US dollars, ETF net inflows over the latest 5-day period were 9.45, compared with a historical mean of 3.55, higher than approximately 73% of comparable weeks. This is an important support for the bullish view: fund flows have not moved against the price recovery. However, the figure is a rolling observation available at the cutoff, not a fresh sum of daily flows within this calendar week or a measure of real-time buying. Next week, new disclosures need to show continued inflows; an existing rolling figure cannot repeatedly be treated as new demand.
The BTC cross-market capital temperature was neutral (+0.11). This composite places ETF flows, stablecoin supply growth, the dollar and the risk environment indicated by VIX in their respective historical contexts. Stablecoin growth was positive but below its historical average, so the broader funding backdrop does not yet indicate widespread strengthening. An increase in stablecoin supply also does not necessarily flow into BTC. If ETF support fades next week without improvement elsewhere, the funding basis for the bullish assessment would become thinner.
BTC's trailing 30-day correlation with US equities was -0.1217, compared with a historical mean of approximately +0.1662. Among 104 comparable weeks, only about 7 were as low or lower. The negative reading points to weak recent co-movement: US equity direction should not mechanically determine expectations for BTC next week, nor does this establish permanent decoupling. The measure reflects a historical window and daily reporting lag. Watch whether the relationship normalizes, whether capital support persists and whether BTC's own price-volume evidence confirms the advance.
VII. Composite signal and next-week scenarios: Keep a conditional bullish view and require demand confirmation
The composite signal is bullish, consistent with recovering prices, short-term moving averages and ETF flows. It is not fully aligned with weak relative activity and aggressive buying at the cutoff, and the capital temperature does not show strong reinforcement. The appropriate conclusion is conditional continuation, not a guarantee of a one-way market merely because most evidence leans positive. Conflicting information should remain central to next week's assessment.
The continuation scenario requires price to maintain its recovery structure, aggressive participation to improve and new fund-flow disclosures to support demand. A test of the week's high accompanied by improving price-volume alignment would strengthen the bullish case. Conversely, persistent net selling during further price gains, followed by a break in the recovery structure and a weakening capital backdrop, would invalidate it. If price remains range-bound and participation fails to improve, conditions would be closer to a consolidation phase awaiting confirmation. Simply remaining above the low would not confirm the trend.
VIII. Risks
Historical rank describes how unusual an observation is, not the probability of a future return. Weekly averages, short-term readings at the cutoff and lagged daily fund-flow measures answer different questions. Agreement between them does not establish causation. Sudden changes in liquidity can invalidate observed price ranges. No news events have been introduced as explanations in this report; the assessment should evolve with verifiable new evidence.
Disclaimer: This report was prepared by dboqo using market data available through 2026-09-07 07:55 UTC+8. Cryptocurrency markets are highly volatile. This report provides an objective analysis of market conditions and does not constitute investment advice. Investors should assess risks independently and exercise prudent judgment.