I. Core Finding and Direction: Strong ETF Flows, but Low Volume and Weak Momentum Limit Upside
Core finding:ETF funding support remains in place, but low trading volume and weak near-term momentum make it difficult for price to extend higher. The funding backdrop and price momentum do not point in the same direction. The outlook increasingly depends on whether range support holds and whether trading activity follows through during rebounds. A bearish assessment remains appropriate, while acknowledging that strong funding conditions limit confidence in a sustained decline.
Data scope:As of 2026-09-07 09:30 UTC+8, this period uses the preceding 24-hour window ending at the same cutoff and compares it with 180 comparable periods. Daily funding data retain their original frequency and are not interpreted as real-time trading activity.
Historical comparison:Trading volume was 66,260 BTC, versus a historical mean of 154,835 BTC. Among 180 comparable periods, only about 16 were as low as or lower than the current reading, placing it at a rarely seen low. This indicates limited participation, so any rebound requires stronger confirmation from trading activity. Net ETF inflows over the past 5 days were 13.56 hundred million US dollars, versus a historical mean net outflow of 0.06 hundred million US dollars, higher than about 89% of comparable periods. This provides a favorable funding backdrop but has not yet removed the constraints from weak volume and price action.
Data-scope review:No potential anomalies in units, frequency, or order of magnitude were identified in this period. A rare historical position does not mean the data are erroneous, nor is it evidence that a trend reversal is inevitable. Daily monetary flows are not accumulated repeatedly, and total trading volume and fund flows are interpreted according to their respective coverage periods.
Directional assessment:Bearish.Assessment horizon:The next 24 hours.Conditions:Rebounds continue to lack volume, near-term momentum does not recover, and price cannot establish a sustained break above the range's upper boundary.Invalidation conditions:Price breaks above and holds the upper boundary, volume recovers, momentum improves, and funding support continues. The bearish assessment should then be reassessed, and the previous interpretation of weakness should not be applied to the new price action.
II. Key Market Data: Gains Are Close to Stalling, Making Range Boundaries More Important Than Directional Labels
BTC/USDT is quoted at 79,928.60, up 0.02% over the past 24 hours. The gain is close to stalling and therefore cannot be treated as a clear uptrend. Price remains between 79,125.30 and 80,536.10: the lower boundary tests whether buyer support remains effective, while the upper boundary tests whether a rebound has gained fresh momentum. Both are scenario boundaries rather than certain targets.
Trading activity is at a rarely seen low in this period, making small price moves more likely to obscure insufficient participation. If volume expands during declines but contracts during rebounds, the bearish evidence will become more consistent. If declines do not produce sustained selling pressure and a subsequent rebound lifts participation, the assessment of weakness should be moderated. The focus is on the price outcome accompanying trading activity; low total volume alone should not be interpreted directly as a bearish signal.
III. Price Action and Trend: Near-Term Momentum Is Weak, While the Longer Horizon Still Provides Counterevidence
MACD is used to observe changes in price momentum. Its near-term momentum histogram is -36.06 USDT, versus a historical mean of +0.39 USDT. Among 180 comparable periods, only about 13 were as low as or lower than the current reading. This indicates weak near-term upside momentum, which, together with low volume, limits the credibility of the rebound. The next point to watch is whether momentum improves alongside another upside test, rather than merely whether the quoted price rises briefly.
At the same time, price remains above the short- and medium-term daily moving averages, so the longer-horizon structure does not provide equally bearish confirmation. Near-term weakness may take the form of consolidation at elevated levels rather than immediately developing into a sustained decline. The interpretation of continued weakness would be strengthened only if range support fails and a rebound cannot reclaim it. If momentum recovers and support remains firm, the bearish conclusion will be challenged.
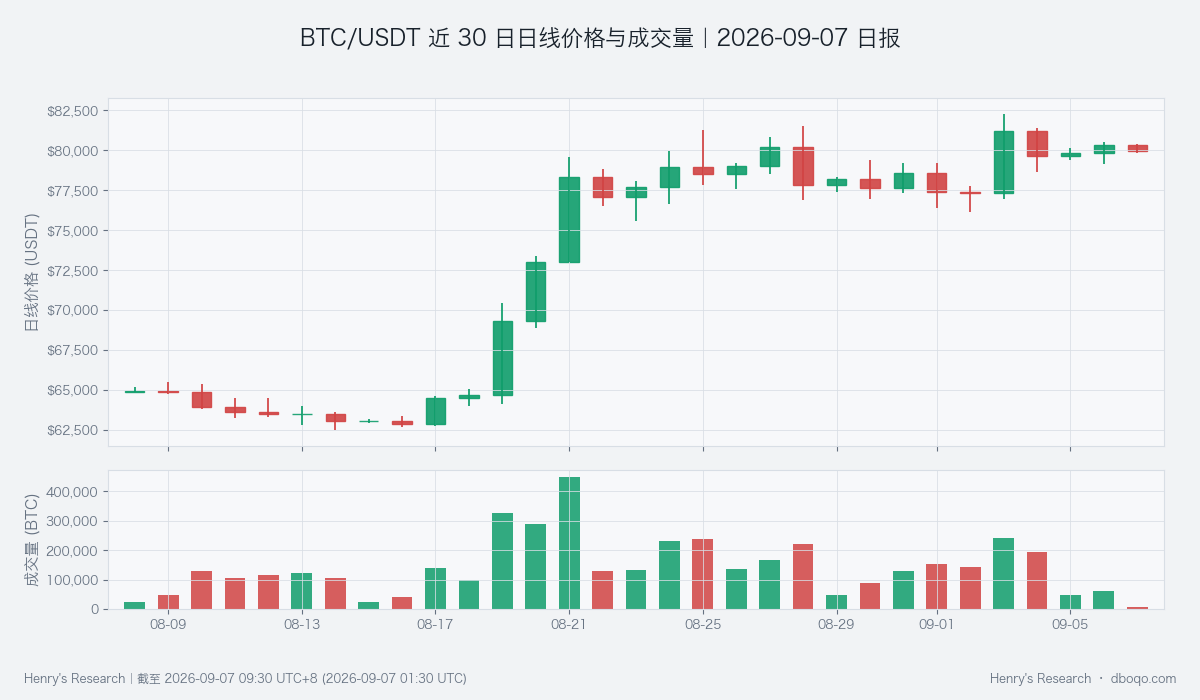
BTC/USDT daily price and volume over the past 30 days; the final day is incomplete, so its volume bar cannot be compared directly with those of complete days.
IV. Volume-Price Structure and Price Range: The Trading Imbalance Has Not Yet Produced an Effective Breakout
Aggressive buying minus aggressive selling is used to distinguish the tendency of trade initiators and differs from total trading volume, which measures participation. Aggressive net buying intensity in this period is close to the historical middle range and does not confirm unusually strong buying. Against a low-volume backdrop, every upward price move therefore requires fresh trading support; a localized buyer advantage cannot be extrapolated into a sustained trend.
The value of range analysis is that it makes the assessment falsifiable. A rapid reversal after touching the upper boundary indicates that opposing supply can still limit the upside. If price pulls back after a breakout but continues to hold above the upper boundary, the supply-demand outcome has changed. If the lower boundary is tested but never breaks, the consolidation scenario should remain in consideration. Bearish conditions become clearer only if that boundary breaks and a recovery attempt fails. Historical statistical positions cannot replace these actual price confirmations.
V. Derivatives Activity: Contract Pricing Is Stable and Does Not Provide Additional Support for Price Weakness
The funding rate is the periodic payment between long and short positions in perpetual contracts and is used to assess whether directional positioning is crowded. The mean for this period is +0.002846%, versus a historical mean of +0.002677%, close to the historical middle range. This means payment pressure has not deviated materially from normal levels, providing insufficient evidence either of abnormal momentum chasing or of market panic.
This section therefore limits overinterpretation of the bearish thesis. The more direct evidence of current weakness comes from trading activity and near-term momentum, not from an extreme anomaly in contract payments. If price continues to weaken while payment levels remain normal, this should not be mechanically interpreted as an unwind of crowded positioning. If payments rise materially during a rebound but price fails to advance, the durability of momentum-driven demand would warrant closer attention.
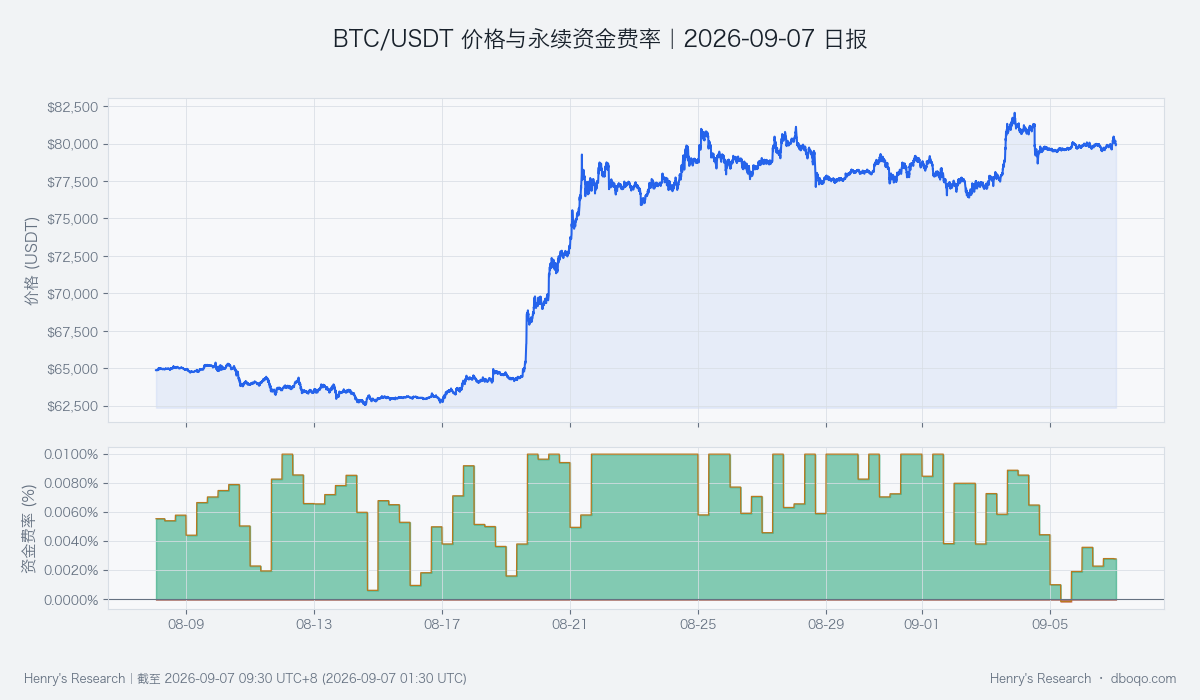
BTC/USDT price and perpetual funding rate over the past 30 days; the payment direction does not equate to the future price direction.
VI. Cross-Market and Funding Conditions: Elevated Liquidity Conditions Are Important Counterevidence to the Bearish Assessment
Cross-market liquidity conditions for BTC are elevated. Considered together, ETF inflows, stablecoin supply growth, and the US dollar and volatility environment provide conditional support for risk demand. This is inconsistent with the near-term weakness in volume and price action, indicating that funding conditions have not yet fully translated into price momentum and that the market cannot readily be described as lacking buyer support.
The ETF flows discussed above are higher than those of most comparable periods, but they cover multiple trading days and cannot be treated as buying that arrived in real time today. An increase in stablecoins also does not mean that all of the additional supply flows into BTC, while the US dollar and volatility factors do not establish one-way causality. The next issue is whether funding support continues and leads to improved trading activity. If price action confirms this chain, it will become the main evidence invalidating the current bearish conclusion.
VII. Composite Signal and Scenario Validation: The Signal Is Bearish, but Public Evidence Remains Materially Divided
The composite signal is bearish, consistent with weak near-term momentum but at odds with the elevated funding backdrop, while low trading volume makes trend confirmation more difficult. This period's bearish assessment is therefore a time-bound and conditional composite judgment and must not be presented as though all evidence supports a decline. The base case is a constrained rebound and repeated range-bound movement; a sustained decline still requires further confirmation through a break of support.
The stronger bearish scenario is that price breaks below the lower boundary and cannot recover it, rebounds lack volume, and funding support weakens at the same time. The opposite scenario is that buyers drive price above the upper boundary and keep it there, trading participation rises, momentum improves, and the existing funding advantage begins to receive confirmation from volume and price action. The latter outcome would invalidate this period's assessment. Validation must consider price outcomes, trading participation, and funding conditions together; a single signal cannot justify extending the conclusion beyond its applicable period.
VIII. Risk Disclosure
Historical samples indicate only this period's relative position and provide neither event probabilities nor return guarantees. Using the same cutoff time also does not eliminate differences between weekends and weekdays or among market regimes. Low trading activity may amplify near-term price fluctuations, daily funding data are subject to lag, and unexpected news may rapidly change the conditions. The conclusion in this report applies only to the stated time horizon and should be updated promptly when counterevidence emerges rather than maintaining a fixed directional view.
Disclaimer:This report was prepared by dboqo based on market data available as of 2026-09-07 09:30 UTC+8. Cryptocurrency markets are highly volatile. This report provides only an objective analysis of market conditions and does not constitute investment advice. Investors must assess risks independently and make prudent decisions.