I. Core Finding and Direction: Active Buying Is Unusually Weak, but Funding Conditions Have Not Turned Cold
Data scope:As of 2026-09-09 09:20 UTC+8, the current observation covers nearly 24 hours, while the historical comparison uses 180 comparable periods with the same cutoff time. Daily funding indicators retain their original statistical windows, and repeated observations are not added together as new funding.
Core finding:Active net buying intensity is at a rare historical low, but cross-market funding conditions have not turned cold in tandem, and prices have not yet disrupted the longer-term upward structure. Selling pressure makes the rebound unconvincing, while the funding buffer limits the basis for directly concluding that the trend has turned bearish. The current market more closely resembles a directional struggle within post-rally consolidation.
Historical comparison:The intensity indicator used to measure active buying relative to active selling is -1.31, versus a historical mean of +0.01. Among 180 comparable periods, only about 6 were as low as or lower than the current reading, placing it at a rare low. This indicates a clear lack of buyer initiative. The next point to observe is whether this intensity can recover consistently during rebounds, rather than treating a brief price rise alone as confirmation that demand has recovered.
Data-scope review:No candidate anomalies in units, frequency, or magnitude requiring exclusion were identified. The rare low describes its historical position and has not triggered the threshold for a statistical anomaly. The intensity reading is neither a buy-sell quantity nor an amount of capital outflow, so a negative value cannot be interpreted as an equivalent amount of capital withdrawal.
Directional assessment:Range-bound. Assessment horizon:The next 24 hours. Conditions supporting the assessment:Price remains within the recent range, active buying does not establish a sustained recovery, and cross-market funding conditions remain neutral. Invalidation conditions:Price breaks above the upper boundary with simultaneous confirmation from buying and trading volume, or falls below the lower boundary while funding conditions turn cold. Either combination would require reassessing the direction.
II. Key Market Data: The Pullback Remains Consolidation, and Volume Does Not Confirm a Breakout
BTC/USDT is at 78,641.60, down 0.88% over the past 24 hours, indicating that price is still absorbing selling pressure following the previous advance. Trading volume over the same period was 129,457 BTC, compared with a historical mean of 153,177 BTC. This is close to the historical midpoint and within the normal range. Volume therefore cannot be described as depleted, nor is there sufficient evidence to characterize the current rebound as a high-volume breakout. The next focus is whether volume strengthens as price approaches the range boundaries and aligns with the direction of active buying.
The direction and persistence of trading activity are critical to the assessment. Normal trading volume can still accompany buyer retreat. If active buying remains weak as price rises, the rebound may merely reflect a temporary easing of selling pressure. Conversely, if the pullback stops expanding and buying gradually recovers, the case for a further decline would weaken even without a sharp increase in total volume.
III. Price Action and Trend: Near-Term Pressure Persists, While Longer-Term Support Remains
Price is below the 10-day moving average of 78,933.14 USDT but remains above the 30-day moving average of 73,666.06 USDT. Moving averages are used to observe trends in average transaction prices across different horizons. This combination indicates that the near-term recovery is encountering resistance, while the longer-term structure has not weakened in tandem. The key is whether price can regain and hold above the short-term moving average, rather than treating a single crossing as a trend recovery.
A near-term rebound and daily-chart consolidation can coexist. Current price action is insufficient either to erase the previous advance or to confirm that the uptrend is accelerating again. If price repeatedly encounters resistance near the short-term moving average, the effect of weak buying becomes more significant. If pullbacks gradually narrow after a recovery, attention should shift to the possibility that resistance is beginning to turn into support.
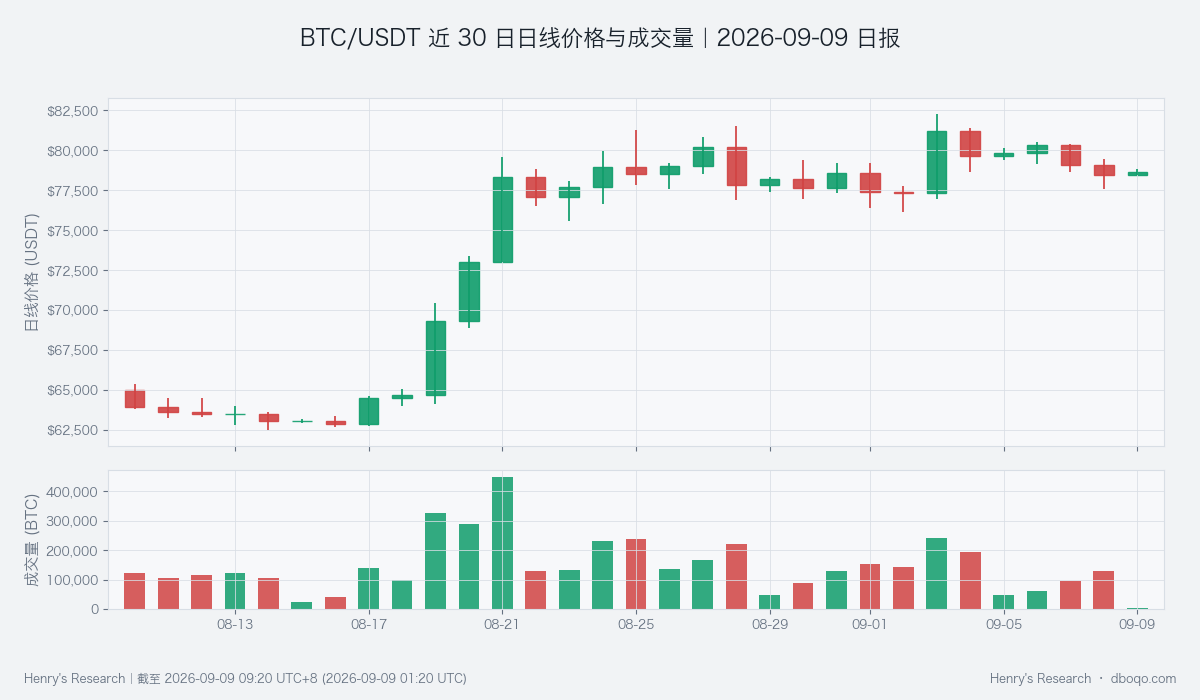
Daily price and trading volume over the past 30 days: watch whether the directional move after consolidation receives volume confirmation.
IV. Price-Volume Structure and Price Range: Buying Recovery Must Be Tested at the Range Boundaries
The price range over the past 24 hours was 77,600.10 to 79,476.00 USDT. The lower boundary provides a reference for whether selling pressure is expanding, while the upper boundary tests whether buyers are genuinely willing to pursue higher prices. These boundaries represent only the price range already observed and are not support or resistance levels guaranteed to hold. A change to the range-bound assessment would be justified only if price holds beyond a boundary and receives confirmation from the direction of trading activity.
Weak active net buying intensity and improvement in the short-term cumulative buy-sell trend are not necessarily contradictory because they capture different aspects of the market. The cumulative trend describes changes in active buying minus active selling over a period, while intensity reflects current buying and selling pressure relative to history. These signals should be allowed to converge before a single short-term improvement is extrapolated into sustained demand. If a rebound toward the upper boundary continues to lack buyer initiative, repeated movement within the range remains more consistent with the available evidence.
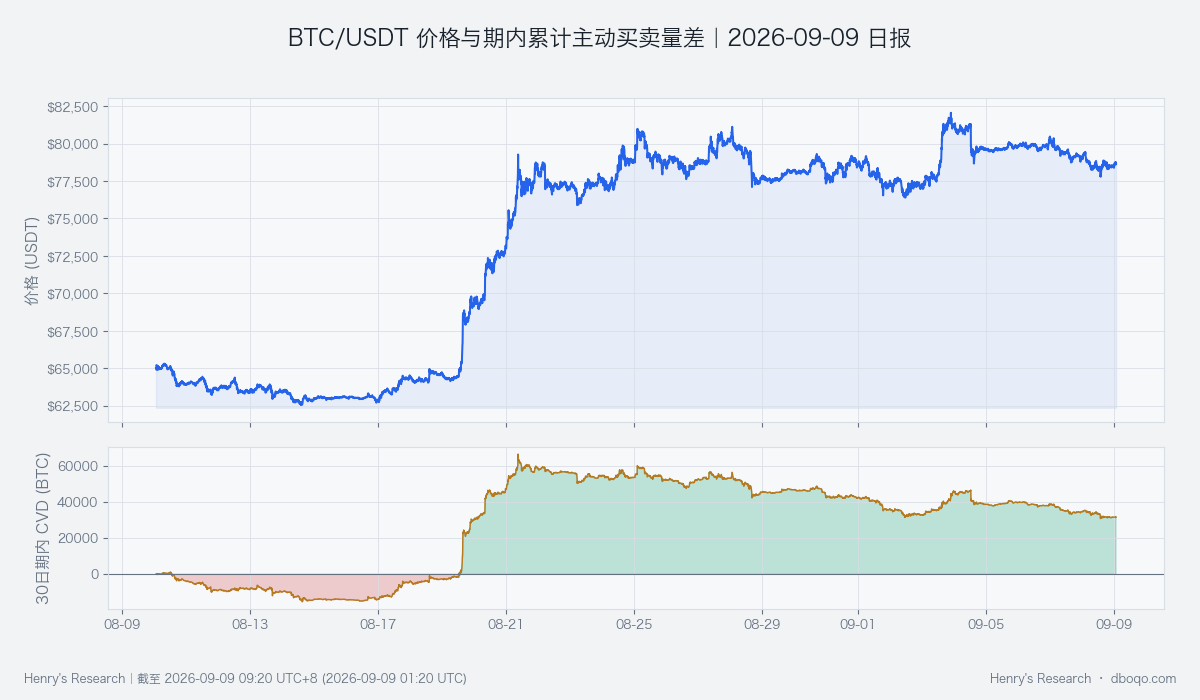
Price and cumulative active buying minus active selling over the past 30 days: the short-term improvement requires joint confirmation from current buying intensity.
V. Derivatives Activity: Funding Rates Are Elevated but Have Not Translated Into a Price Advantage
The funding rate is a periodic payment arrangement between long and short positions in perpetual contracts; a positive rate generally means longs pay shorts. The average over the current period of nearly 24 hours was +0.007270%, compared with a historical mean of +0.002750%. It was higher than about 86% of comparable periods, placing it at an elevated level. This indicates that bullish demand remains willing to bear the cost, but it is inconsistent with the price decline and weak active buying. Willingness to pay cannot substitute for actual buying support.
This divergence warrants attention but is insufficient on its own to conclude that the market is overheated or about to fall sharply. If funding rates remain elevated while price repeatedly encounters resistance, the risk that bullish expectations fail to materialize will increase. If buying recovers and helps price stabilize, the same cost may instead reflect resilient demand. Price-volume confirmation is required, and the next price direction cannot be inferred directly from the funding level.
VI. Cross-Market and Funding Conditions: Funding Temperature Is Neutral as Macroeconomic Support and Pressure Offset Each Other
BTC cross-market funding temperature is neutral. ETF net inflows over the past 5 days were 6.98, versus a historical mean net inflow of 0.14 (both in hundreds of millions of US dollars). This was higher than about 75% of comparable periods, placing it at an elevated level. This provides counterevidence to weak buying, but elevated cumulative inflows can coexist with weak recent funding-flow intensity: the cumulative amount does not indicate whether new demand is accelerating. The next step is to observe whether inflows persist and translate into price support.
Growth in stablecoin supply and a relatively weak US dollar provide a buffer, while the VIX risk factor, which reflects expected volatility in US equities, creates pressure. With these forces offsetting one another, no clear funding direction has emerged. An increase in stablecoins does not mean the funds have already purchased BTC, and a weaker US dollar does not guarantee a rise in BTC. If risk appetite deteriorates further, neutral funding conditions may turn cold. If funding support persists and buying recovers, the upper boundary will have a better chance of being broken effectively.
VII. Combined Signals and Scenario Validation: Signals Lean Bearish, but Funding Counterevidence Supports a Range-Bound Assessment
The combined signal leans bearish, consistent with insufficient active buying and near-term price pressure, but it does not fully align with neutral funding conditions and support from the longer-term structure. After combining this evidence, the range-bound assessment is maintained for the next 24 hours, with the balance of risk centered on whether the rebound fails. Localized bearish evidence cannot be directly upgraded into a conclusion that all evidence is uniformly bearish.
The base case is repeated movement within the range while buying and selling pressures remain unresolved. An upside invalidation requires price to hold above the upper boundary, active buying to strengthen, and trading volume to confirm the move. A downside invalidation requires the lower boundary to fail, selling pressure to persist, and funding conditions to cool. If price only moves briefly beyond a boundary without confirmation from the other conditions, uncertainty should be preserved pending new evidence.
VIII. Risk Disclosure
Historical samples describe relative positioning and do not represent the probability of future outcomes. Different market regimes may change the explanatory value of the indicators. ETF and macroeconomic indicators follow their own update schedules, so daily changes cannot be treated as real-time funding activity. Unexpected news, liquidity changes, and price gaps may invalidate the range assessment. All directional conclusions are subject to the conditions above.
Disclaimer:This report was prepared by dboqo based on market data available as of 2026-09-09 09:20 UTC+8. Cryptocurrency markets are highly volatile. This report provides only an objective analysis of market conditions and does not constitute investment advice. Investors must assess risks independently and make prudent decisions.