One. Core Finding and Direction: VIX Pressure Is Unusually High, While the Bullish Bias Still Requires Price-and-Volume Confirmation
Core finding: VIX risk-appetite pressure has risen to an unusually high level, but stablecoin expansion and a weaker U.S. dollar provide a buffer, and BTC has not yet developed a uniformly bearish funding environment. VIX measures expected U.S. equity market volatility. The anomaly in this period is its risk pressure relative to its own history, not a new high in the index level. Price remains constrained by the short-term moving average, so the bullish view indicates a recovery bias and cannot be interpreted as meaning that a breakout has already occurred.
Data scope:As of 2026-09-10 09:20 UTC+8, the analysis examines the preceding 24 hours ending at the same cutoff time and compares them with 180 comparable periods; daily flow indicators retain their respective observation windows.Historical comparison:The VIX risk-pressure reading relative to history is +2.19, compared with a historical mean of -0.37; among 180 comparable periods, only about 3 were higher than the current reading, placing it at an unusually high level. This suggests that external risk appetite may constrain a recovery, and it remains necessary to observe whether easing pressure coincides with sustained BTC buying. This reading is a dimensionless comparative value, not the VIX index level.
Data-scope review:No potential anomalies in units, frequency, or scale were identified in this period. The VIX movement is a statistical market anomaly; daily flow data are not repeatedly accumulated at intraday frequency.Directional assessment:Bullish.Assessment horizon:The next 24 hours.Conditions for validation:The recent low holds, active buying continues, price gradually reclaims the short-term moving average, and funding conditions do not cool.Invalidation conditions:Price falls below the recent low as selling pressure expands, or external risk pressure rises further while funding conditions cool; in that case, the recovery bias should be withdrawn.
Two. Key Market Data: Normal Trading Volume Is Not Yet Sufficient to Confirm an Upside Breakout
BTC is quoted at 78,211.70 USDT, down 0.55% over the past 24 hours, indicating that price performance during the period has not yet realized the bullish bias. Trading volume was 155,549 BTC, versus a historical mean of 152,721 BTC, close to the historical middle range and within normal levels. Volume showed neither abnormal contraction nor the clear increase needed for a strong breakout. The next point to assess is whether a rebound can persist with supporting volume, rather than whether price merely rises briefly.
The most important distinction in this period is that the realized price outcome differs from the conditional assessment: a decline has occurred, while the forward bias depends on whether buying and funding conditions improve. Normal trading volume can support turnover within a range, but cannot by itself prove that selling pressure has been absorbed. If price instead declines as volume increases, the same rise in trading activity should be interpreted as increased risk.
Three. Price Action and Trend: Short-Term Recovery Faces Moving-Average Resistance
Price is below the 10-day moving average of 78,996.09 USDT, indicating that the short-term average trading center remains above the market. This is also why the bullish assessment must remain conditional. The next focus is whether price can reclaim this level and maintain buying support during pullbacks; a single touch of the moving average is insufficient to prove that the trend is recovering. At the same time, price remains above the medium-term moving average, preserving a distinction between the current pullback and a broad weakening of the medium-term structure.
Short-term momentum remains within its historical normal range, so near-neutral oscillation should not be interpreted as one-way acceleration. The assessment sequence should begin with whether support holds, then whether the moving average can be reclaimed, and only afterward whether the upper boundary can open. If the first step fails, subsequent bullish projections lack a foundation. If the first two steps occur but volume does not follow, a range-bound interpretation should still be retained.
Four. Price-Volume Structure and Trading Range: Improved Buying Must Translate into Price Support
The recent cumulative change in active buying minus active selling is positive, indicating some improvement in local buying support. However, full-day active net-buying intensity remains close to normal, so local improvement cannot be equated with sustained capital inflows. The two observation windows are not contradictory: short-term buying can recover while the full-day price remains under pressure. This evidence will strengthen the bullish assessment only if buying continues and pushes price above the moving average.
The low of 77,706.10 USDT over the past 24 hours is the level for validating buying support, while the high of 79,737.30 USDT is the level for validating the upper boundary. These prices come from the realized trading range and are not targets that must be reached. If buying recovers after a pullback to the lower boundary, the recovery conditions gain support. If price breaks above the upper boundary but quickly retreats, the move is more consistent with a test within the range. A break below the lower boundary accompanied by expanding selling pressure would directly contradict the main thesis for this period.
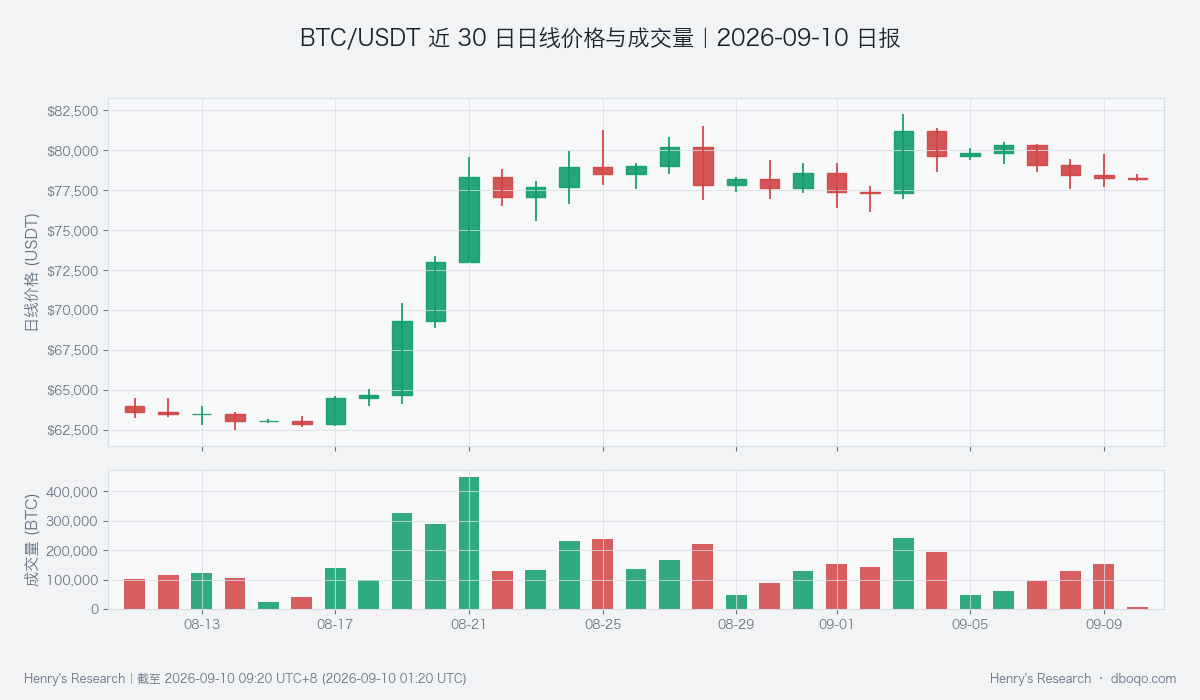
BTC/USDT daily price and trading volume over the past 30 days: assess whether rebounds receive volume support.
Five. Derivatives Anomaly: Positive Funding Rates Do Not Provide Consistent Confirmation
Funding rates are periodic payments between long and short positions in perpetual markets, with positive values indicating that the long side bears the cost. The mean for the comparable window in this period is +0.006157%, versus a historical mean of +0.002826%, higher than about 77% of comparable periods and therefore at an elevated level. This indicates the presence of bullish demand, but it also increases vulnerability if the recovery remains delayed. The next point to assess is whether price improves in line with the direction of funding payments.
This comparison uses the window mean and does not mix the single reading at the cutoff time into the historical mean comparison. The indicator does not meet the criteria for a data-scope anomaly, and elevated funding costs alone cannot establish extreme crowding. The futures-spot basis remains slightly negative, indicating that derivatives have not provided strong confirmation through expanding premiums over spot. If funding costs remain elevated while price weakens, the bullish bias would be undermined.
Six. Cross-Market and Funding Conditions: Neutral Funding Temperature Buffers VIX Pressure
BTC's cross-market funding temperature is neutral, meaning that the effects of ETF flows, stablecoins, the U.S. dollar, and expected U.S. equity volatility offset one another and have not yet created a consistent directional force. Stablecoin supply increased by 0.35% over 7 days, compared with a historical mean decline of 0.06%, higher than about 79% of comparable periods and therefore at an elevated level. This represents an improvement in potential funding conditions, but supply expansion does not mean that the funds have already purchased BTC; confirmation from price and volume remains necessary.
ETFs still recorded net inflows over the past 5 days, but the strength of those inflows is weak relative to history. A weaker U.S. dollar provides a buffer, while VIX risk pressure acts as an opposing constraint. These factors have different observation windows and cannot be added together as though they represented the day's inflow amount, nor can U.S. equity market risk be directly mapped onto the size of a BTC decline. The key point to monitor is whether funding temperature turns from neutral to cool at the same time as price breaks down. If both occur together, the explanatory power of external pressure will strengthen.
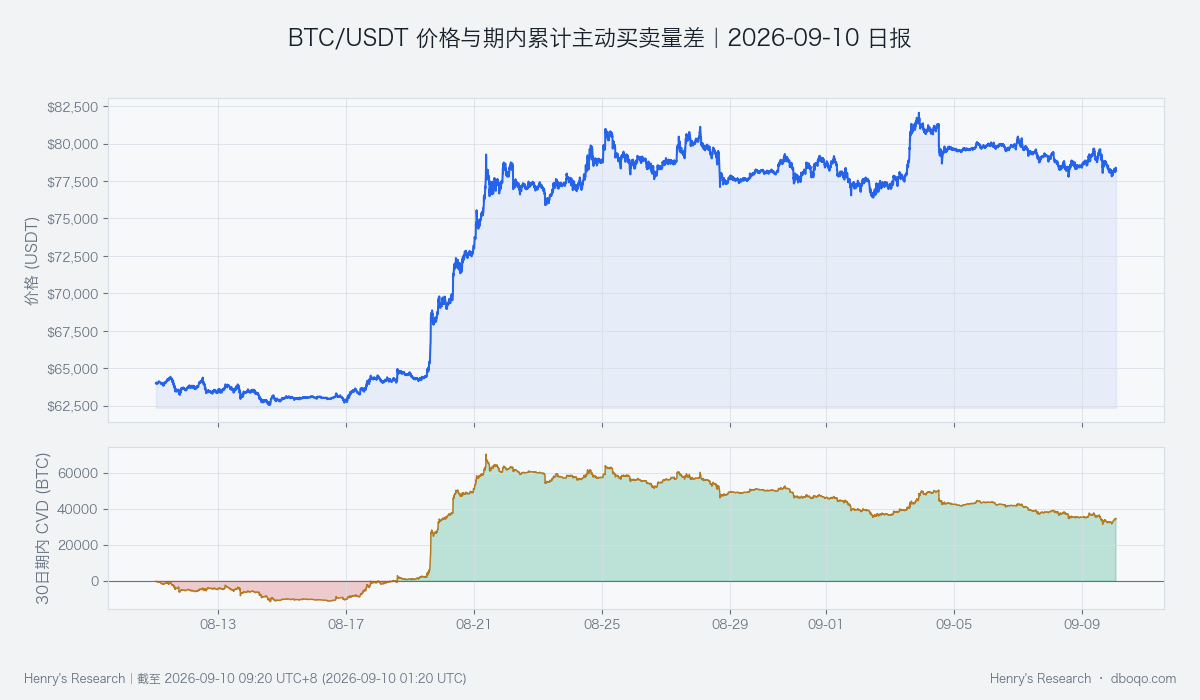
BTC/USDT price and active buying minus active selling over the past 30 days: assess whether buying translates into price support.
Seven. Composite Signal and Scenario Validation: A Neutral Signal Requires the Bullish View to Accept Contrary Evidence
The composite signal indicates range-bound trading, consistent with neutral funding temperature and normal trading volume, but it does not fully confirm the final bullish assessment. The bullish view depends mainly on local buying and improving funding conditions, while resistance from the short-term moving average and VIX pressure are contrary evidence. The current conclusion should therefore be understood as a conditional recovery bias and not as broad confirmation across all signals.
The base scenario is a recovery toward the short-term moving average after the low holds. The stronger scenario is the simultaneous appearance of a reclaimed moving average, a breakout above the upper boundary, and supporting volume. The opposing scenario is mutual confirmation among a failed low, expanding selling pressure, and cooling funding conditions. If price rises but buying does not persist, the range-bound interpretation should be retained. If the opposing scenario occurs, the bullish assessment should be rejected rather than defended on the basis that the medium-term structure remains stable.
Eight. Risk Notice
Historical positioning indicates how common the current phenomenon has been, not the probability of a future outcome. Cross-market relationships may change, daily flow indicators are subject to publication schedules and delays, and short-term buying can reverse. The increase in VIX relative pressure should be understood separately from the absolute level of the index. The assessment in this report is valid only within the stated horizon and conditions. If subsequent price, volume, and funding conditions cease to align, the assessment should be revisited.
Disclaimer: This report was prepared by dboqo based on market data as of 2026-09-10 09:20 UTC+8. Cryptocurrency markets are highly volatile. This report provides only an objective analysis of market conditions and does not constitute investment advice, and investors must assess risks independently and make prudent decisions.