I. Core Finding and Direction: VIX Pressure Stands Out, While Buying Recovery Leaves Insufficient Evidence for a One-Way View
Data scope:As of 2026-09-11 09:20 UTC+8, price and volume are observed over the past 24 hours and compared with 180 historically comparable windows ending at the same time; lower-frequency capital data retain their original observation periods, without repeatedly accumulating daily values.
Core finding:Relative risk pressure reflected by the VIX is unusually high. BTC's price decline aligns with this pressure, but the cumulative trend in aggressive buying and selling has improved. The market therefore appears to be balancing recovery against risk pressure, and the short-term buying rebound is not yet sufficient evidence of a sustained advance.
Historical comparison:The VIX relative historical pressure reading is +4.48, versus a historical mean of -0.37. Among 180 comparable periods, only about 0 were higher than the current reading, placing it at an unusually high level. This indicates that the risk environment is notably distant from its own recent norm. The reading must not be treated as the VIX index level and does not mean that the index has reached an all-time high. The next points to watch are whether risk pressure subsides and whether BTC's price structure recovers at the same time.
Data-scope review:No potential anomalies in units, frequency, or magnitude were identified. The prominent change in this period is a market-statistical anomaly. The relative pressure reading has been distinguished from the raw index, and the short-term buying slope is not treated as a full-day net inflow.Directional view:Range-bound.Assessment horizon:The next 24 hours.Conditions supporting the view:Improved buying can support the recent lows, while macro risk and overhead price resistance continue to limit further gains.Invalidation conditions:The current range-bound view must be abandoned if price remains above the recent upper boundary with simultaneous confirmation from buying and capital flows, or falls below the recent lower boundary as aggressive selling regains dominance.
II. Key Market Data: Clear Intraday Decline Without Confirmation of a Trend Reversal
BTC is quoted at 76,841.90 USDT, down 1.75% over the past 24 hours, compared with an average historical gain of 0.08% over equivalent windows. This period's performance was lower than about 84% of comparable periods, placing it at a relatively low level. This means risk pressure has been accompanied by actual price weakness, and the full-period loss should not be overlooked because of a rebound in the final segment. The current price locates the stage of the recovery, while the historical comparison of the price change indicates the relative extent of this decline; the two are not interchangeable.
The next priority is whether the rebound can hold, rather than each individual price movement. If price quickly returns to the starting point of the recovery, improved buying may represent only temporary support. If pullbacks progressively narrow, the alignment between elevated risk pressure and price weakness may begin to weaken. Current volume is near its historical norm and does not support declaring either extreme market panic or a strong breakout based on volume alone.
III. Price Action and Trend: Short-Term Recovery Remains Constrained by Longer-Term Resistance
Price remains in a recovery phase following the recent daily decline, with improving short-term momentum coexisting with pressure on the daily timeframe. This distinction matters: stronger short-term conditions can explain a rebound but cannot directly prove that the longer-term trend has strengthened. When reading the price chart, the sequence of highs and lows on completed daily candles should be separated from the final, unfinished daily candle. Low volume on an unfinished candle must not be misinterpreted as a sharp decline in full-day trading activity.
If the rebound encounters resistance but still holds the latest low, the interpretation that pressure is being absorbed within the range will become more persuasive. If highs continue to move lower, improved short-term momentum will be insufficient to support a bullish conclusion. This assessment depends on price persistence, not a momentary move across a reference line. Easing risk pressure will increase confidence in a strengthening outlook only if it occurs together with a price recovery.
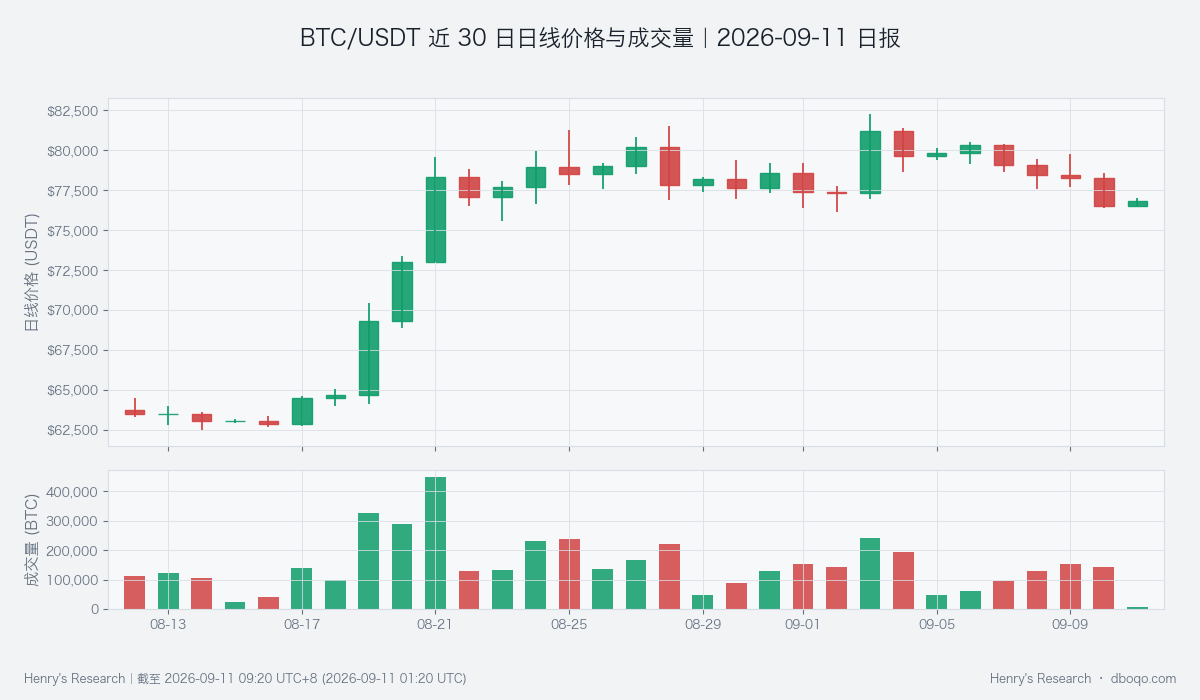
Daily price and volume over the past 30 days; the final daily candle is incomplete.
IV. Price-Volume Structure and Price Range: Improved Aggressive Buying Is Important Counterevidence Against a Bearish View
The cumulative aggressive buying and selling slope reflects the recent rate of change in aggressive buying minus aggressive selling. It is +175 BTC in this period, versus a historical mean of -14 BTC. Among 180 comparable periods, only about 16 were higher than the current reading, placing it at an unusually high level. This indicates that recent support has strengthened and provides important counterevidence against a directly one-sided bearish conclusion. However, it measures the recent rate of change; it is neither the total buying volume over the past 24 hours nor sufficient to offset previously accumulated selling pressure.
The lower boundary of the recent price range is 76,402.90 USDT and the upper boundary is 78,543.90 USDT. They are used, respectively, to test whether support fails and whether the rebound genuinely clears resistance; neither is a return target. If buying improves but price remains unable to advance toward the upper boundary, the price impact of that buying is limited. If the lower boundary breaks and aggressive selling strengthens again, the current range-bound view will face clearer counterevidence.
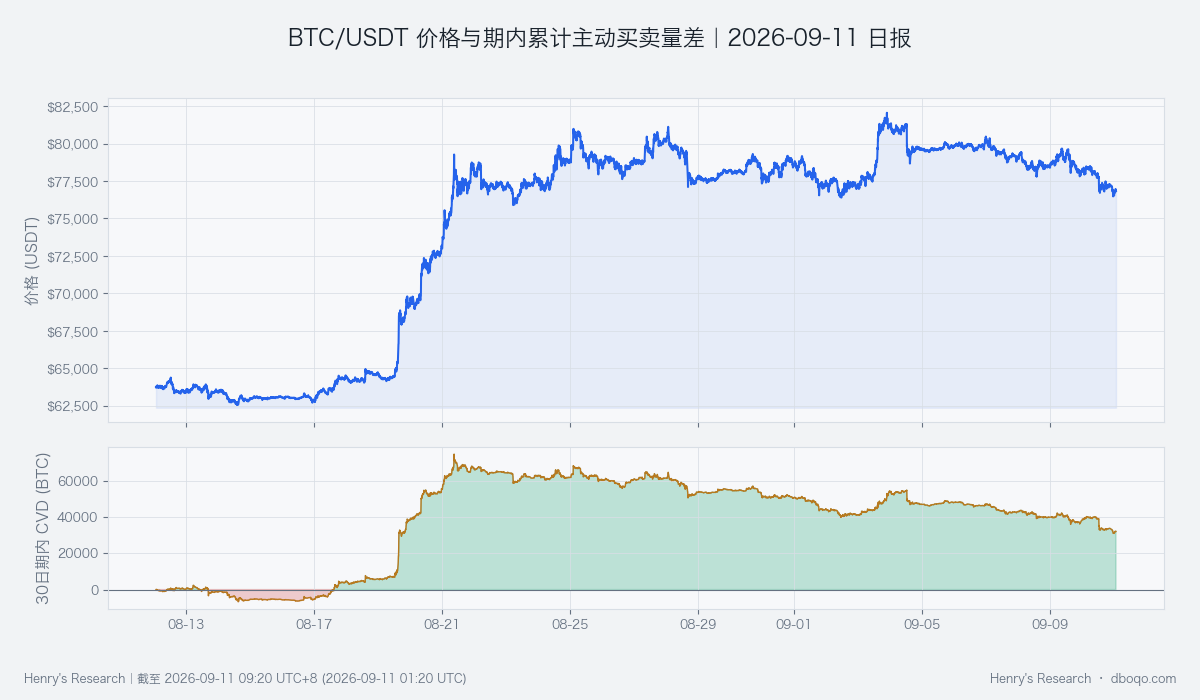
Price and cumulative aggressive buying minus aggressive selling over the past 30 days; the cumulative level and the recent rate of change have different meanings.
V. Derivatives Anomaly: Elevated Funding Costs Require Caution Against Sentiment Running Ahead of the Rebound
The funding rate is a periodic payment between long and short participants in the perpetual market; a positive value usually means that long positions pay the fee. The average over the past 24 hours is +0.006177%, versus a historical mean of +0.002858%, and is higher than about 77% of comparable periods, placing it at a relatively high level. This indicates that bullish financing demand has not fully cooled despite the price decline. It increases vulnerability if the rebound stalls, but cannot by itself imply that the next move will necessarily be lower.
This comparison uses averages over equivalent windows, not a single funding rate at the cutoff time, and it must not be directly extrapolated to an annualized figure. If costs continue rising without a corresponding price recovery, the divergence between market enthusiasm and price impact will reinforce the risk constraint. If costs moderate while buying support holds, conditions will be more consistent with pressure being absorbed within the range. Derivatives evidence is used here to assess rebound quality, not as an independent trend forecast.
VI. Cross-Market and Capital Conditions: Neutral Capital Conditions Have Not Yet Offset Risk Pressure
Cross-market capital conditions for BTC are neutral. ETF net inflows and expanding stablecoin supply provide some support, while the US dollar's weakness relative to its own history also helps ease external constraints. However, ETF flow strength is not pronounced, and relative VIX risk pressure is elevated, preventing these conditions from forming a consistently strong capital environment. A capital buffer therefore does not mean that new capital is already driving a sustained BTC advance.
ETFs reflect a specific investment channel, stablecoin supply reflects potential liquidity capacity, and the US dollar and VIX describe the external environment. These four measures cannot be directly added together as cash flowing into BTC. The next step is to observe whether capital support persists and improves together with price and aggressive buying. A decline in external risk alone will remain insufficient to confirm an advance if price stays under pressure. If capital conditions weaken, existing support may become harder to sustain.
VII. Composite Signal and Scenario Validation: The Range-Bound Consensus Requires Sustained Coordination Between Price and Buying
The composite signal is range-bound, consistent with neutral capital conditions and with the tension between price weakness and improved recent buying. This means the evidence has not yet formed a stable one-way consensus, and neither the buying recovery nor VIX pressure should be overstated. The base case is repeated price movement within the recent range, with rebound persistence constrained by the risk environment and the extension of declines tested by buying support.
Invalidating this view to the upside requires price to remain above the upper boundary, aggressive buying to persist, and joint confirmation from improving capital conditions or easing risk pressure. Invalidating it to the downside requires the lower boundary to fail, selling pressure to strengthen, or capital conditions to deteriorate further. An isolated boundary breach, a short-term change in funding costs, or a single macro indicator is insufficient for validation. A scenario change depends on whether the evidence appears simultaneously and persists.
VIII. Risk Disclosure
Historical comparisons describe relative standing and do not provide the probability of an event. Unusually high risk pressure may persist or subside quickly. Statistical update times and observation periods differ across markets, so related changes must not be interpreted as certain causation. Short-term support may fail, and sudden news may cause price to cross range boundaries rapidly. This assessment applies only to the stated observation horizon and should be reassessed as new evidence on price, price-volume structure, and capital conditions becomes available.
Disclaimer:This report was prepared by dboqo based on market data available as of 2026-09-11 09:20 UTC+8. Cryptocurrency markets are highly volatile. This report provides only an objective analysis of market conditions and does not constitute investment advice, and investors must assess risks independently and make prudent decisions.