I. Core Finding and Direction: Weak ETF Flows Mean the Price and Volume Recovery Still Requires Confirmation
Core finding: ETF flow strength is at a rare low, while the short-term recovery in price and aggressive buying still supports upside potential. The central tension is that capital from outside the trading market has not yet confirmed this recovery. Bullish evidence exists, but it is not yet sufficient to treat the rebound as a renewed acceleration of the daily trend.
Data scope: As of 2026-09-12 09:20 UTC+8, the current observation covers the past 24 hours and is compared with up to 180 historical 24-hour samples ending at the same time of day. ETF and stablecoin data retain their original multi-day statistical windows, and daily indicators use completed daily bars.
Historical comparison: ETF flow strength is -1.48, compared with a historical mean of +0.10. Among 180 comparable periods, only about 10 were as low as or lower than the current reading, placing it at a rare low. This measures fund-flow strength relative to its own history, not the amount of capital or the size of a decline. It indicates that insufficient external demand remains a constraint on the rebound, and the next point to watch is whether flows can improve consistently.
Data-scope review: No candidates with anomalous units, frequencies, or magnitudes were found. A rare low does not directly indicate anomalous data or mean that an extreme market shock has occurred. Daily and multi-day data were not repeatedly accumulated at intraday frequency.
Directional view: Bullish, provided that the price and volume recovery continues. Assessment horizon: The next 24 hours. Conditions for validity: The recent low holds, aggressive buying continues to improve, and price gradually reclaims the short-term daily moving average. Invalidation conditions: Price falls below the recent low while buying weakens, or the rebound repeatedly encounters resistance as fund flows continue to deteriorate; in either case, the bullish view should be withdrawn.
II. Key Market Data: Active Trading Has Not Yet Produced an Effective Breakout
The latest BTC price is 77,292.20 USDT, up 0.59% over the past 24 hours. This shows some price recovery, but the move is not yet large enough to confirm a breakout. Trading volume is 204,762 BTC, compared with a historical mean of 152,420 BTC, higher than about 83% of comparable periods and therefore elevated. Greater participation provides a foundation for the recovery, but it also indicates that disagreement between buyers and sellers remains. If trading stays active while price continues to face resistance, the assessment of buying efficiency should be lowered.
Accordingly, this report does not interpret elevated volume alone as bullish. The key question is whether active trading can establish a higher accepted price range rather than merely produce a brief surge. Observing whether pullbacks become shallower at the same level of activity will test this thesis more effectively than adding unrelated indicators.
III. Price Action and Trend: Short-Term Improvement Remains Constrained by the Daily Moving Average
The latest price remains below the 10-day moving average of 78,773.80 USDT, but above the 30-day moving average of 75,033.56 USDT. This indicates that a short-term recovery and longer-term support coexist, while overhead pressure has not yet been removed. The two moving averages distinguish trend horizons; they are not price levels that necessarily trigger a reversal. If price subsequently holds above the short-term moving average, the bullish view will receive more direct price confirmation. If demand also disappears near the long-term moving average, the foundation of the recovery will need to be reassessed.
This explains why the current view can be conditionally bullish without claiming that the advance has been fully confirmed. Price must first demonstrate that it can absorb overhead supply, and capital must then demonstrate a willingness to follow before confidence in continuation can increase. The sequence is not necessarily fixed, but uncertainty should remain if either element is absent.
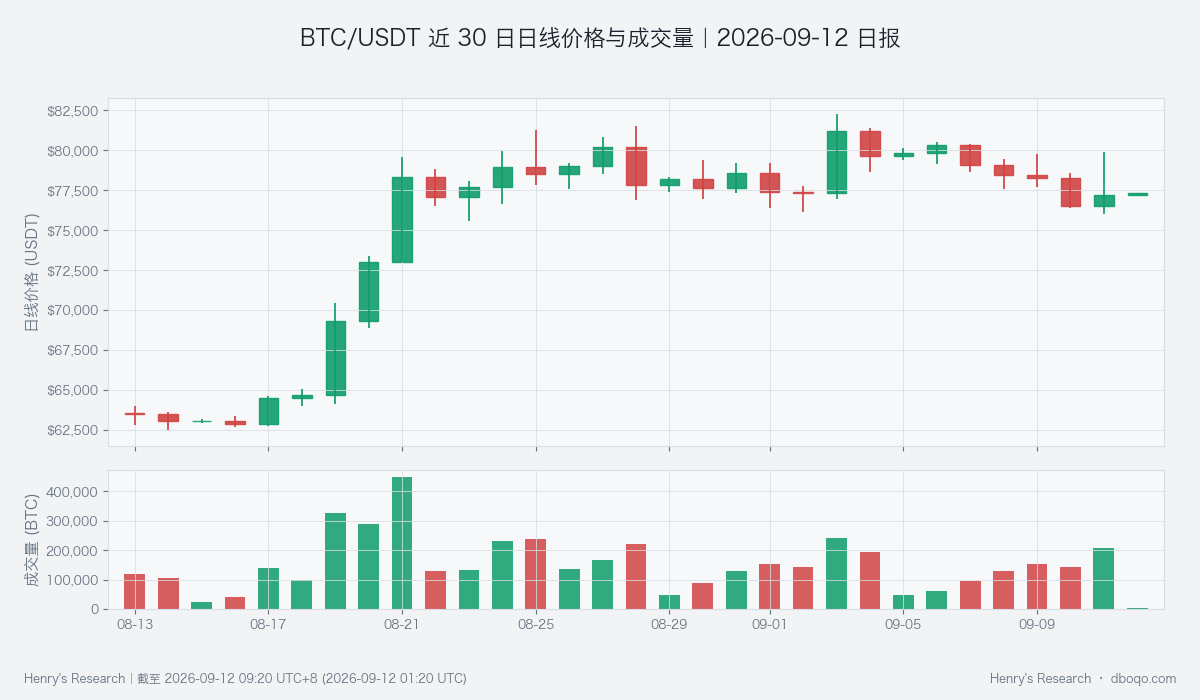
Daily price and volume over the past 30 days; observe whether active trading translates into a higher price range.
IV. Price-Volume Structure and Price Range: Recovering Buying Is the Main Support for the Bullish View
The slope of the cumulative change in aggressive buys minus aggressive sells is +67 BTC, compared with a historical mean of -13 BTC. It is higher than about 70% of comparable periods and slightly above normal. This indicator tracks the recent direction of change in the aggressive trading imbalance; it is not the total net inflow over the past 24 hours. It supports the interpretation that buying is improving, but it does not prove that new capital from outside the trading market has arrived. The next question is whether this buying can persist during price pullbacks.
The price range over the past 24 hours is 76,000.30 to 79,859.80 USDT. The lower bound is the direct validation boundary for the current view, while the upper bound tests whether buying can absorb supply following the earlier surge. A brief move above the upper bound followed by a rapid reversal cannot be treated as an effective breakout. If price remains below the lower bound and aggressive buying weakens, the existing bullish thesis will lose both price and trading support.
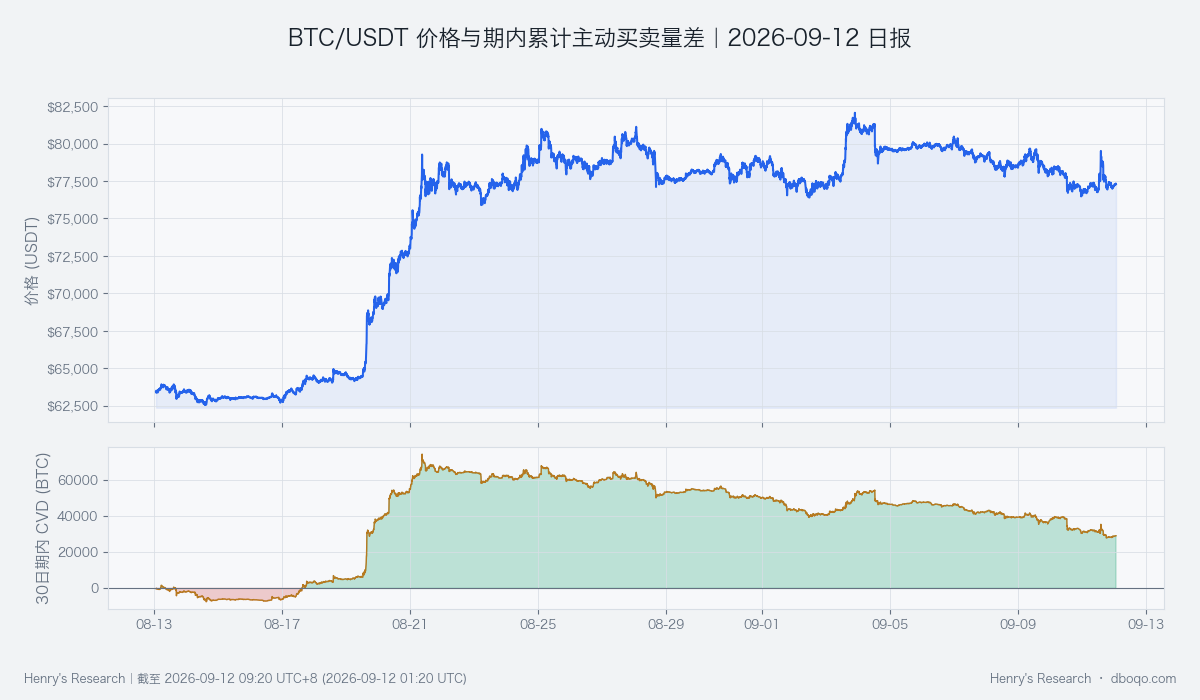
Price and cumulative aggressive buys minus aggressive sells over the past 30 days; the cumulative change cannot be treated directly as an external capital inflow.
V. Derivatives Activity: The Futures-Spot Spread Has Not Yet Confirmed Rebound Demand
The futures-spot basis—the price difference between derivatives and spot—is currently -0.05%, close to its historical mean of -0.05% and in the middle of its historical range. This indicates that the slight discount is not a new extreme in this period and does not independently confirm a clear increase in demand. Its importance is that it reminds readers that the price and volume recovery and derivatives pricing are not yet fully aligned; a price rebound alone does not show that risk appetite has strengthened broadly.
This evidence reduces confidence in the assessment rather than independently overturning the bullish direction. If price rises while the discount narrows, consistency will improve. If the discount widens and price loses support, it should be assessed together with weakening buying, avoiding strong conclusions drawn directly from a small price difference.
VI. Cross-Market and Funding Conditions: Neutral Funding Conditions Constrain Upside Confirmation
Cross-market funding conditions for BTC are neutral. ETFs recorded net outflows of 5.58 hundred million US dollars over the past 5 days, indicating that this channel has not yet provided net new demand. Longer-term stablecoin expansion offers some buffer, but recent supply changes are close to normal and cannot be equated with capital having purchased BTC. The US dollar is weak relative to its own history, helping to ease some external constraints, while the risk pressure reflected by the VIX remains elevated and limits an optimistic interpretation.
These factors offset one another, so the unusually weak ETF flows have not been clearly reversed by other funding channels. Funding conditions describe a composite state of multiple factors and do not establish a deterministic cause of price changes. The next points to watch are whether ETF outflows narrow, whether stablecoin expansion continues, and whether external risk pressure eases. Only when these directions gradually align can funding conditions be said to provide stronger support for the price recovery.
VII. Combined Signal and Scenario Validation: The Bullish Consensus Still Requires Capital to Follow
The combined signal is bullish, consistent with improvements in short-term price and aggressive buying, but it remains in tension with weak ETF flows and neutral funding conditions. The base case is therefore a conditional recovery while support holds, rather than unconditional confirmation of a sustained advance. If moving-average resistance is absorbed, buying continues, and fund flows improve, the assessment will become more robust. If price merely moves back and forth within the range while funding does not improve, the market is better described as range-bound with a weak recovery.
The alternative scenario is a break below the lower bound accompanied by weaker aggressive buying or continued deterioration in external funding. If this combination occurs, the original view should be acknowledged as invalid rather than maintained based on a single indicator that remains favorable. The value of the combined signal is that it provides a testable direction; subsequent price and funding evidence can always overturn it.
VIII. Risk Notice
Historically similar positions do not guarantee a repetition of historical paths, and low-frequency funding statistics may lag intraday changes. Changes in weekend liquidity, unexpected news, and cross-market risk repricing may quickly invalidate the range. These conditions apply only to the stated assessment horizon. The directional description does not promise returns and cannot replace ongoing review of new information.
Disclaimer: This report was prepared by dboqo based on market data available as of 2026-09-12 09:20 UTC+8. Cryptocurrency markets are highly volatile. This report provides only an objective analysis of market conditions and does not constitute investment advice; investors must assess risks independently and make prudent decisions.