One. Core finding and direction: Buying intensity has risen to a rare high, while low volume limits bullish confidence
Data scope: As of 2026-09-13 09:20 UTC+8, the review covers the most recent 24 hours aligned with the cutoff and compares them with 180 historical windows having the same cutoff time. Core finding: Active net buying intensity is clearly strong, but overall trading is sparse and price has not yet produced a breakout supported by broad participation. The coexistence of localized buyer dominance and broad market hesitation is the most notable tension in this period.
Historical comparison: Active net buying intensity is +2.67, compared with a historical mean of -0.00. Among 180 comparable periods, only about 3 were higher than the current reading, placing it at a rare high. This measure captures the degree to which aggressive buying deviates from aggressive selling; it is neither a purchase amount nor a return. The rounded historical mean is close to zero, so a growth multiple cannot be calculated from it. The reading indicates that short-term buyers are more active, but it does not prove large-scale capital inflows.
Data-scope review: Checks of units, frequency, and magnitude found no anomaly candidates requiring exclusion from the directional assessment; buying intensity represents a market dislocation. Daily-frequency data are not accumulated according to the number of intraday repetitions. Directional assessment: Bullish, but conditional. Assessment horizon: The next 24 hours. Conditions for validity: The aggressive buying advantage persists, trading volume recovers, and price holds above the lower boundary of the recent range. Invalidation conditions: The buying advantage disappears and price falls below the lower boundary of the range, or price declines on rising volume. If price merely remains range-bound on low volume, confidence in the bullish outlook should also be reduced.
Two. Key market data: Price is nearly flat, and thin trading is the main counterevidence
BTC/USDT is quoted at 77,299.50 USDT, with a change of +0.01% over the past 24 hours, meaning that the overall price has barely moved. The strong localized buying reading has not yet translated into a clear full-day advance. The next point to observe is whether price can continue moving higher, rather than treating the intensity at a single point in time as an established trend.
Trading volume over the same period was 39,253 BTC, compared with a historical mean of 152,826 BTC. Among 180 comparable periods, only about 2 were as low as or lower than the current reading, placing it at a rare low. This is the most direct counterevidence to the bullish assessment: when participation is limited, a small amount of trading can also move short-term indicators, making breakout durability harder to verify. Confirmation requires a recovery in volume accompanied by rising prices; higher volume with weakening prices would instead increase risk.
Three. Price action and trend: Short-term strength has not removed daily resistance
The current price is below the 10-day moving average of 78,768.08 USDT and above the 30-day moving average of 75,493.09 USDT. These moving averages reflect average closing prices over their respective numbers of days. Trading below the short-term average indicates that the recent recovery still faces resistance, while remaining above the medium-term average preserves a longer-horizon buffer. Together, they show that a short-term bullish view does not mean the daily trend has resumed a one-way advance.
The assessment should begin with a valid breakout from the immediate range, followed by observation of whether demand remains stable near the short-term moving average. If price merely touches resistance and then retreats while trading remains sparse, the touch cannot be treated as trend confirmation. If a decline is accompanied by stronger aggressive selling, the medium-term buffer should be viewed only as an area requiring verification and cannot guarantee that the decline will stop.
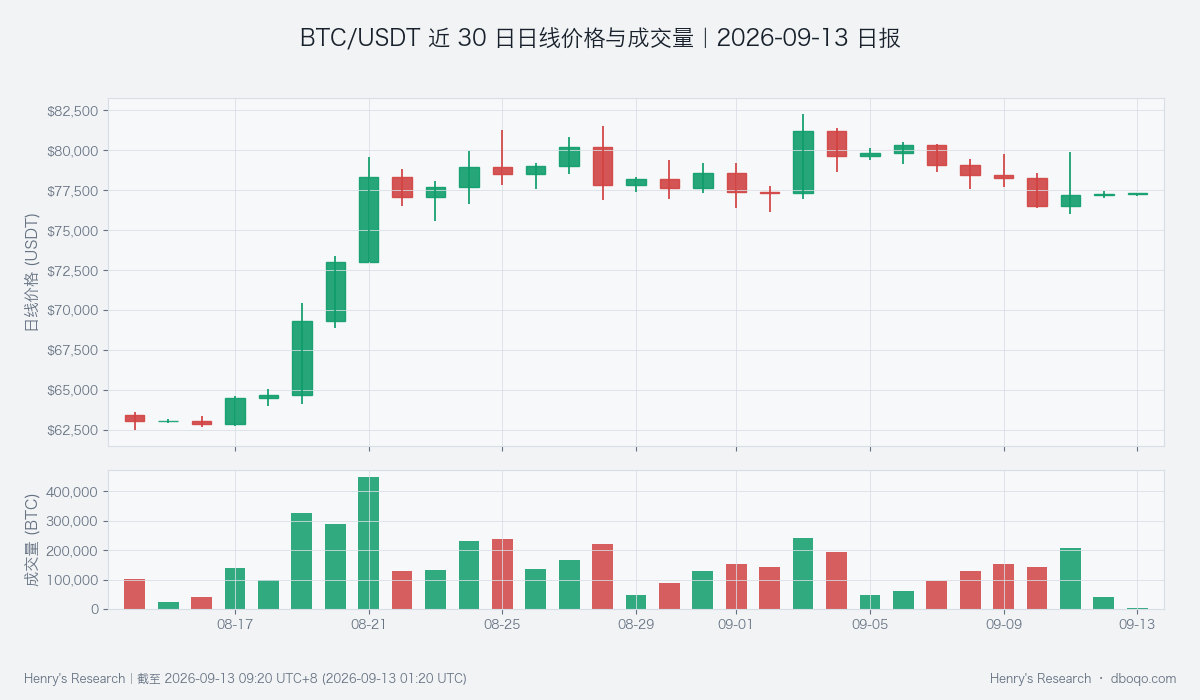
BTC/USDT daily price and trading volume over the past 30 days. RSI is used to observe recent upward and downward momentum and does not guarantee subsequent direction.
Four. Volume-price structure and price range: The buying advantage requires a range breakout to be realized
The price range over the past 24 hours was 77,025.10 to 77,477.40 USDT. The upper and lower boundaries come from the actual trading range and serve as reference lines for assessing whether buying can push price out of consolidation; they are not certain support levels or targets. The bullish assessment would gain new price evidence only if trading persists above the upper boundary alongside a buyer advantage. If price falls below the lower boundary and cannot recover it, the central thesis of this report would be directly contradicted.
Active net buying measures the relative strength of aggressive buying minus aggressive selling, while trading volume measures the scale of participation; the two are not interchangeable. The former is currently prominent and the latter weak, so the more reasonable interpretation is that localized demand is dominant while broad participation remains absent. Subsequent buying continuity, volume recovery, and range behavior should be assessed together to avoid selecting only the most optimistic reading.
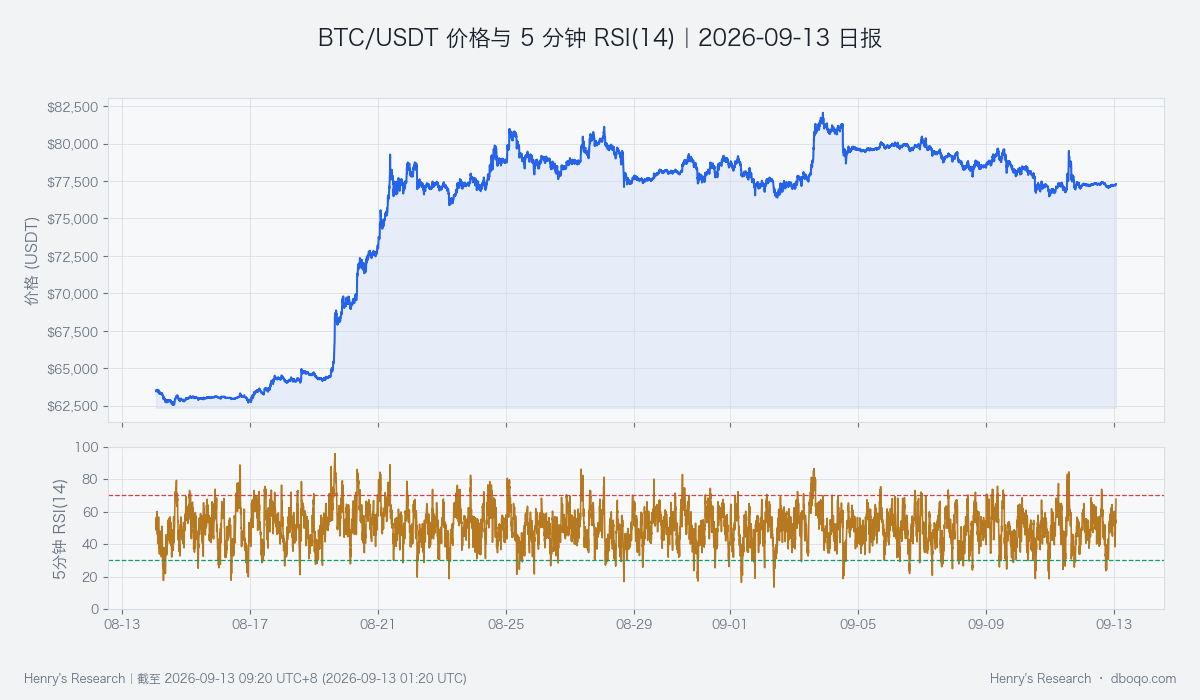
BTC/USDT price over the past 30 days and 5-minute RSI(14). RSI is used to observe recent upward and downward momentum and does not guarantee subsequent direction.
Five. Derivatives developments: Evidence remains insufficient to elevate the buying dislocation into broad confirmation
Derivatives evidence did not rank among the leading core findings in this period, so unrelated figures should not be added merely to complete a category. Funding rates measure the periodic cost paid between the two sides of perpetual contracts, while basis measures the price difference between derivatives and spot. They describe trading demand and pricing relationships but cannot directly prove new spot-market inflows.
Against a low-volume backdrop, even localized improvement in derivatives readings becomes informative only when it appears together with sustained buying and a price breakout. If derivatives pricing subsequently weakens and price falls out of the range, confidence in the buying-intensity signal should be reduced. If the movement is only temporary while the spot structure remains intact, it is not sufficient on its own to invalidate the central thesis.
Six. Cross-market and funding conditions: The funding backdrop is neutral and lacks consistent external momentum
The cross-market funding backdrop for BTC is neutral. ETF flows and short-term stablecoin supply are weak, while longer-term stablecoin expansion and US dollar factors provide a partial offset; volatility-related risk factors remain restrictive. This combination means that the funding environment is not broadly aligned with short-term buying, but it also does not provide evidence of sustained tightening sufficient to determine direction on its own.
ETFs recorded net outflows of 4.76 (in hundreds of millions of US dollars) over the past 5 days, indicating that this channel is not currently providing net-inflow support. This is a cumulative multi-day amount and must not be interpreted as an outflow occurring on the current day alone. The next step is to observe whether this channel improves and to assess it together with stablecoin supply and market participation. An increase in stablecoins does not necessarily flow into BTC, and changes in the US dollar or volatility do not establish certain causality. Therefore, the neutral funding backdrop only constrains confidence in the bullish view and does not guarantee that price will remain unchanged.
Seven. Combined signal and scenario validation: The bullish view aligns with localized volume-price evidence but awaits broader participation
The combined signal is bullish and consistent with strong active net buying, but it is not fully aligned with evidence of low trading volume and a neutral funding backdrop. The assessment therefore retains an upward bias while treating the ability to attract broader participation as the key test. Multiple short-term phenomena from the same source must not be counted repeatedly as independent confirmation.
The upside scenario requires sustained buying, a recovery in volume, and price stability after leaving the range. The sideways scenario is that buying fails to produce a breakout and price continues consolidating on low volume. The downside scenario is that the buyer advantage fades and price breaks lower on rising volume. The latter two outcomes would weaken or invalidate the bullish assessment. Observation should focus on changes in the evidence as a whole; counterevidence must not be ignored merely because a directional conclusion already exists.
Eight. Risk disclosure
Historical comparisons describe the position of past windows measured on the same basis and do not represent the probability of future outcomes. A rare high does not imply that the condition will necessarily persist, and unusually low volume does not imply that a large price move is imminent. Indicators covering the past 24 hours and daily indicators use different observation horizons and should not be combined into a single certain trend. Funding channels update at different intervals, while unexpected news and changes in liquidity may rapidly invalidate the conditions.
This report focuses on the tension between buying intensity and market participation. Whether this tension is jointly resolved by price, volume, and funding evidence should be monitored continuously. When confirmation is insufficient, uncertainty should be retained, and neither the observation range nor the bullish assessment should be interpreted as a promise of certain returns.
Disclaimer: This report was prepared by dboqo based on market data available as of 2026-09-13 09:20 UTC+8. Cryptocurrency markets are highly volatile. This report provides only an objective analysis of market conditions and does not constitute investment advice, and investors must assess risks independently and make prudent decisions.