One. Core finding and direction: Volatility has narrowed to an unusually low level, making downside risk more noteworthy amid weak volume
Data scope: As of 2026-09-14 09:20 UTC+8, the review covers the latest 24 hours aligned with the cutoff and compares them with 180 historical windows sharing the same cutoff. Core finding: Short-term volatility is at a rare low, without sufficient trading volume or consistent funding support. The market appears calm, but this calm is better understood as waiting for directional confirmation and does not show that risk has declined.
Historical comparison: Short-term realized volatility is +0.05%, compared with a historical mean of +0.11%. Among 180 comparable periods, only about 15 were as low as or lower than the current reading, making it an unusually low reading. This measures the dispersion of recent price changes, not the full-day range or a future decline. Low volatility means current price changes are concentrated, but it does not predict the direction of the next breakout; subsequent volume and price action must confirm it together.
Data-scope review: Checks of units, frequency, and magnitude found no measurement anomalies requiring exclusion from the directional assessment. The unusually low volatility describes its historical position and has not triggered the statistical anomaly threshold. Daily data are not accumulated according to intraday repetition counts, and volume measures from different windows are not treated as if they shared the same scale. Directional assessment: Bearish, subject to conditions. Assessment horizon: The next 24 hours. Conditions for confirmation: Price fails to reclaim the range ceiling, sellers dominate as volume recovers, and funding support remains insufficient. Invalidation conditions: Price holds above the range ceiling with sustained aggressive buying and expanding volume. If the market merely moves sideways on low volume, the downside view lacks confirmation and confidence should be reduced.
Two. Key market data: Price declined on low volume, without strong one-sided confirmation
BTC/USDT is quoted at 76,750.20 USDT, changing -0.71% over the past 24 hours. This indicates that the price center has moved lower, but a single-day decline alone does not prove that the trend is accelerating. When it coincides with low volatility, attention should focus on whether price can subsequently recover lost ground, rather than extrapolating the current decline into the next period.
Trading volume over the same period was 74,933 BTC, versus a historical mean of 151,439 BTC. It was lower than approximately 88% of comparable periods, indicating subdued participation. This is the second key piece of evidence: insufficient participation weakens the credibility of an upside breakout, while also indicating that the decline has not received broad volume confirmation. A subsequent volume expansion accompanied by falling prices would strengthen the bearish case; a price recovery with sustained volume expansion would directly contradict it.
Three. Price action and trend: Short-term recovery faces resistance, while the medium-term buffer still requires validation
The current price is below the 10-day moving average of 78,325.51 USDT and above the 30-day moving average of 75,952.76 USDT. These moving averages reflect average closing prices over their respective periods. The former indicates that the short-term recovery still faces resistance, while the latter suggests that a buffer remains over the longer horizon. This explains why caution is appropriate in the short term without directly declaring that the medium-term structure has turned fully bearish.
Low volatility does not mean downside safety, nor does it imply that market movement must expand immediately. The assessment should first test the current range and then examine support near the moving averages. If selling pressure increases, the buffer zone remains only an area awaiting validation. If buyers can sustain a recovery of lost ground, the short-term weakness must be reassessed. Daily and short-term readings reflect different scales and should not be mechanically combined into a definitive trend.
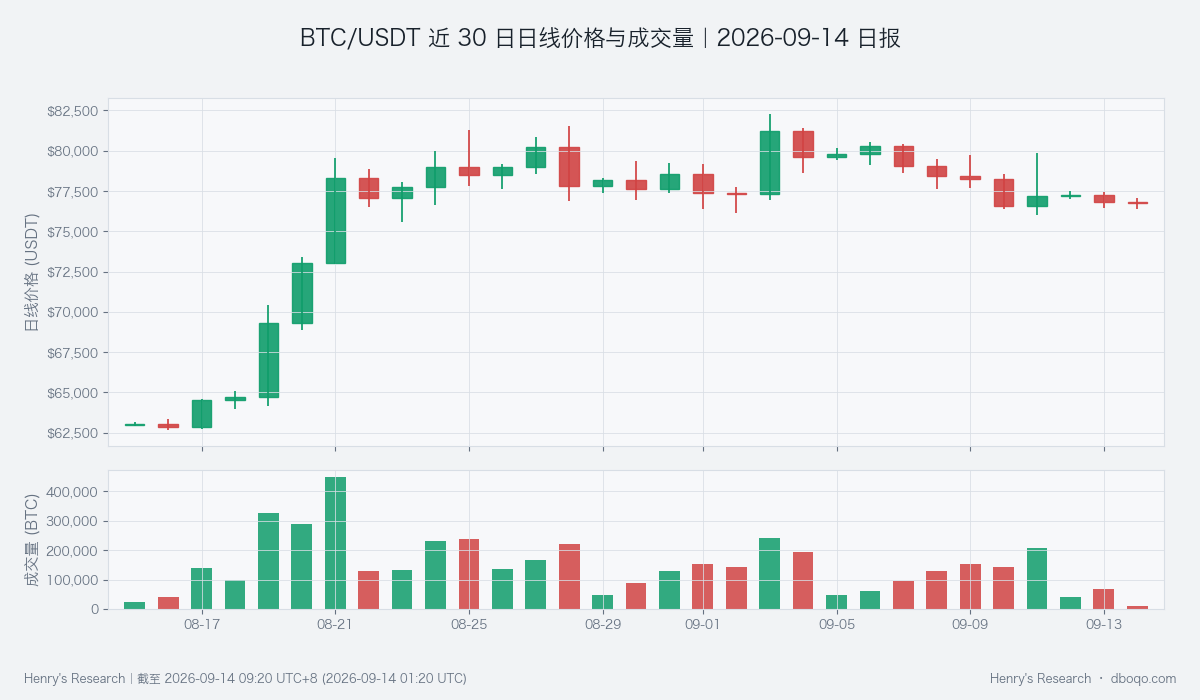
BTC/USDT daily price and volume over the past 30 days. Whether volume recovers alongside price is central to evaluating breakout durability.
Four. Price-volume structure and trading range: A local recovery in volume cannot substitute for full-day participation
The relative volume level is +1.07, compared with a historical mean of +1.03. It is higher than approximately 86% of comparable periods, indicating an elevated reading. This third piece of evidence measures the change in local trading activity relative to its own recent baseline and does not conflict with low cumulative full-day volume. It indicates some recovery in local activity, but cannot yet be interpreted as a clear expansion of funding across the market. The next question is whether this recovery can persist and affect price.
The range over the past 24 hours is 76,350.10 to 77,427.40 USDT. Both boundaries come from the actual price range and serve as observation lines for testing direction, not as guaranteed support or targets. A break below the lower boundary with sustained seller-led volume would make the downside risk following low volatility more concrete. Holding above the upper boundary, together with continued dominance of aggressive buying over aggressive selling, would invalidate the current bearish bias. Merely touching a boundary or moving beyond it briefly is insufficient confirmation.
Five. Derivatives developments: A relatively strong long-side bias provides counterevidence to the bearish assessment
The relative long-short deviation is +1.27, compared with a historical mean of +0.01. It is higher than approximately 82% of comparable periods, indicating an elevated reading. This fourth piece of evidence describes how the long-short structure is tilted relative to its own norm; it is neither a funding amount nor a probability of price appreciation. It preserves the possibility of long-side demand, so the bearish assessment cannot be presented as fully aligned across all evidence.
If the derivatives-side bias drives sustained aggressive buying and a recovery above the range ceiling, it would weaken the bearish assessment. If it remains confined to derivatives readings while price stays under pressure, it has not yet translated into effective support. The funding rate measures the periodic cost paid between the two sides of perpetual contracts. Changes in this cost shown in the chart must be interpreted together with price and cannot independently be treated as new spot demand or a guarantee of future direction.
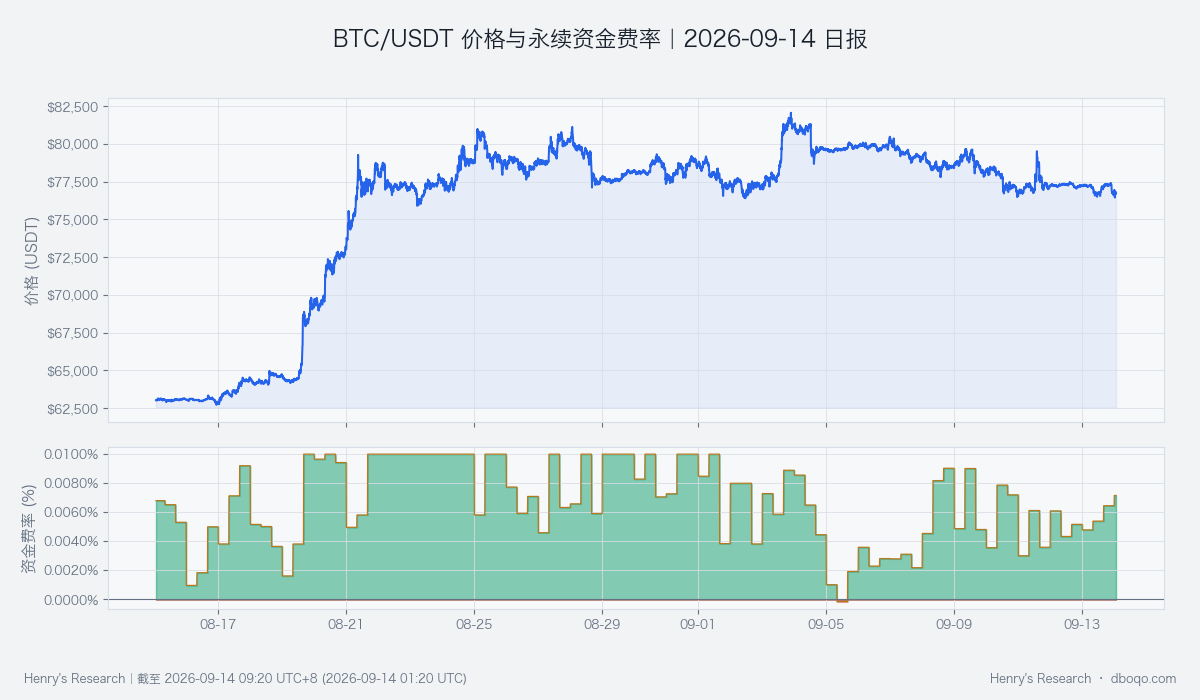
BTC/USDT price and perpetual funding rate over the past 30 days. The rate reflects the cost of contract payments and should be assessed together with price and volume.
Six. Cross-market and funding conditions: Funding conditions are neutral, without consistent upward impetus
Cross-market funding conditions for BTC are neutral, constituting the fifth key piece of evidence in this report. ETF flows and short-term stablecoin supply are weak, while longer-term stablecoin expansion and US dollar factors provide a partial offset; volatility-related risk factors remain restrictive. Overall, the external environment does not provide consistent support, but it is also insufficient to establish broad-based funding contraction.
ETF net outflows over the past 5 days were 4.42 hundred million US dollars, indicating that this channel currently lacks net inflow support. This is a cumulative multi-day figure and must not be treated as an outflow for the current day alone. The next points to monitor are whether outflows narrow and whether an improvement in stablecoin supply coincides with a recovery in market participation. Stablecoin growth does not necessarily flow into BTC, while US dollar and volatility factors do not establish certain causation. Neutral funding conditions limit directional confidence but do not guarantee that price will remain unchanged.
Seven. Combined signal and scenario validation: The bearish bias is consistent with price weakness, but counterevidence remains
The combined signal is bearish, consistent with the price decline and the lack of a unified funding impulse, but not fully aligned with the local recovery in volume and the relatively strong long-side bias. The core assessment is therefore conditional downside risk under weak participation, not a confirmed one-sided decline. Low volatility describes only the background and must not be counted repeatedly as bearish evidence.
The downside scenario requires seller-led volume expansion and a decisive breakdown. In the sideways scenario, neither side attracts sustained participation, so confidence in the bearish assessment should be reduced. The upside scenario requires sustained buying, expanding volume, and a stable move above the range ceiling, jointly invalidating the current assessment. Evidence should be monitored for changes in combination to avoid selecting only readings that support the existing conclusion.
Eight. Risk notice
Historical comparisons describe relative positions among past windows measured on the same basis and do not represent probabilities of future outcomes. Short-term calm may persist or may be disrupted by unexpected news or changes in liquidity. When volume is insufficient, brief movements near range boundaries are harder to interpret. Daily funding information is updated at different intervals, and local volume cannot substitute for full-day volume or vice versa.
This report emphasizes the coexistence of low volatility, weak participation, and counterevidence. Whether the directional assessment is confirmed depends on the subsequent combined behavior of price and volume, while changes in funding conditions will alter its credibility. Every observation line requires renewed validation and must not be interpreted as guaranteeing a halt to declines, a breakout, or a certain return.
Disclaimer: This report was prepared by dboqo based on market data available as of 2026-09-14 09:20 UTC+8. Cryptocurrency markets are highly volatile. This report provides only an objective analysis of market conditions and does not constitute investment advice, and investors must assess risks independently and make prudent decisions.