I. Core Findings and Direction This Week: Low Trading Activity and Cooling Flows Still Make the Rebound Difficult to Sustain
Data scope: This report covers the full natural week from UTC 2026-09-07 00:00 to 2026-09-14 00:00, with market data through 2026-09-13 23:55 UTC and 104 complete historical natural weeks used for comparison; weekly price is calculated from open to close, while lower-frequency flow data retain their respective measurement windows.
Core finding: BTC fell 4.35% for the week, closing at 76,805.00 USDT. More importantly, the decline came with relatively low trading activity and cooling flows, while intraweek rebounds lacked confirmation from sustained buying. The weakening linkage with U.S. equities also means their performance cannot be directly used to infer that BTC will recover in tandem.Historical comparison: BTC's correlation with U.S. equities was -0.049, versus a historical mean of +0.162. It was lower than about 89% of comparable weeks, placing it at a relatively low level; trading volume was also relatively low. Correlation near zero does not mean the two have formed a reliable inverse relationship.
Methodology review: No candidate anomalies in units, frequency, or magnitude were found. A historically low reading does not mean the data are erroneous; both rolling ETF amounts and daily liquidations avoid duplicate accumulation.Directional assessment: Bearish.Assessment horizon: The next natural week, from UTC 2026-09-14 to 2026-09-21.Conditions for the assessment: Price remains constrained by short-term moving averages, active selling has not eased, and outflows show no improvement.Invalidation conditions: Price sustainably reclaims short-term moving averages while active buying strengthens and ETF flows return. In that case, confidence in the bearish scenario should be reduced, rather than treating every modest rebound as invalid.
II. Historical Comparison and Key Changes: Weak Linkage and Low Turnover Jointly Weaken the Case for an External Recovery
The most important comparison this week is insufficient trading participation: weekly volume was 835,848 BTC, versus a historical mean of 1,251,295 BTC. It was lower than about 88% of comparable weeks, placing it at a relatively low level. This gap shows that the price decline occurred amid weaker trading participation, so any rebound needs subsequent volume confirmation; it neither proves panic selling on its own nor proves that sellers are exhausted.
Weak linkage with U.S. equities combined with low trading activity leaves little basis for the view that improving external risk appetite can lift BTC. Both pieces of evidence suggest that next week should first focus on BTC's own buying support and trading volume, then assess whether cross-market changes are moving in sync. Being statistically near the lower end of history only indicates a weaker environment; it cannot automatically imply the following week's decline, probability of occurrence, or a fixed market path.
III. Price Action and Trend: Intraweek Advance Reversed, and Short-Term Repair Has Not Yet Overcome Trend Constraints
The price path supports caution: price declined early in the week, midweek rebounds repeatedly met resistance, and although there was a clear late-week rise, it did not hold in the higher range. The full-week range was 76,000.30 to 80,410.80 USDT; the lower bound represents an area of demand already seen this week, while the upper bound represents a price boundary not yet firmly regained. Both are levels for testing strength next week, not support or return targets that will necessarily take effect.
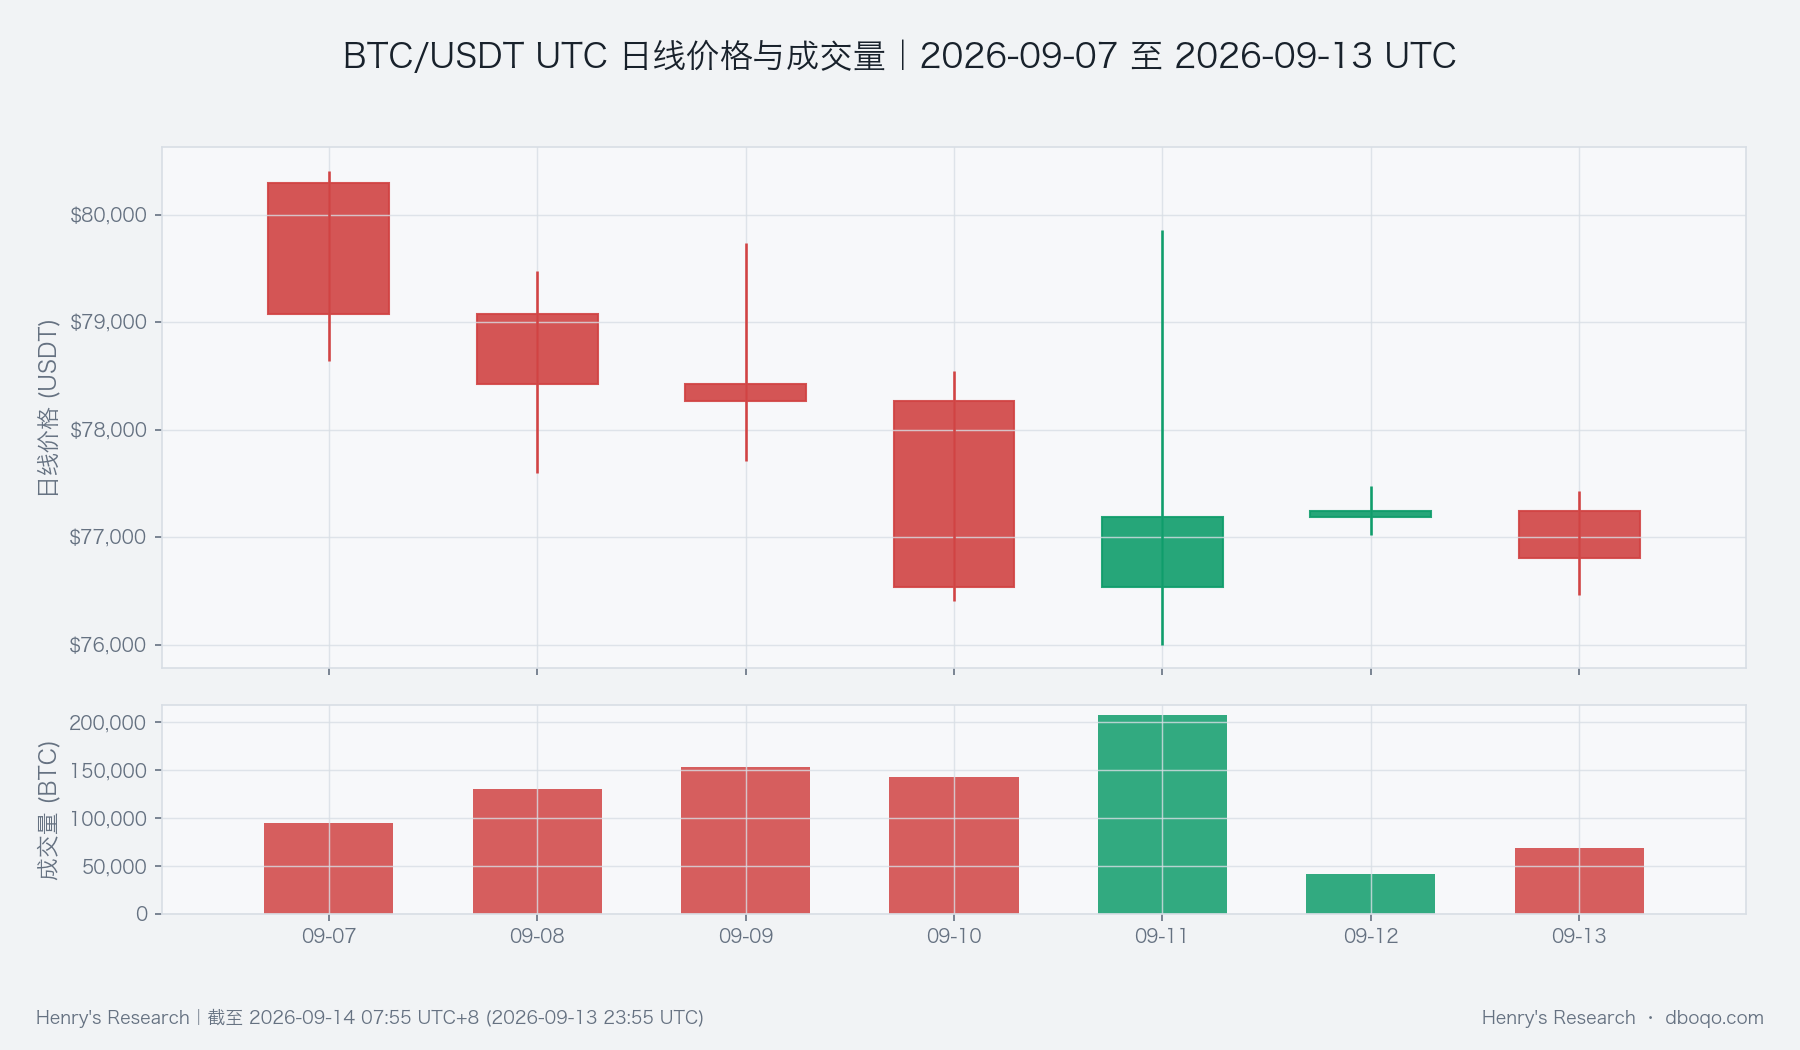
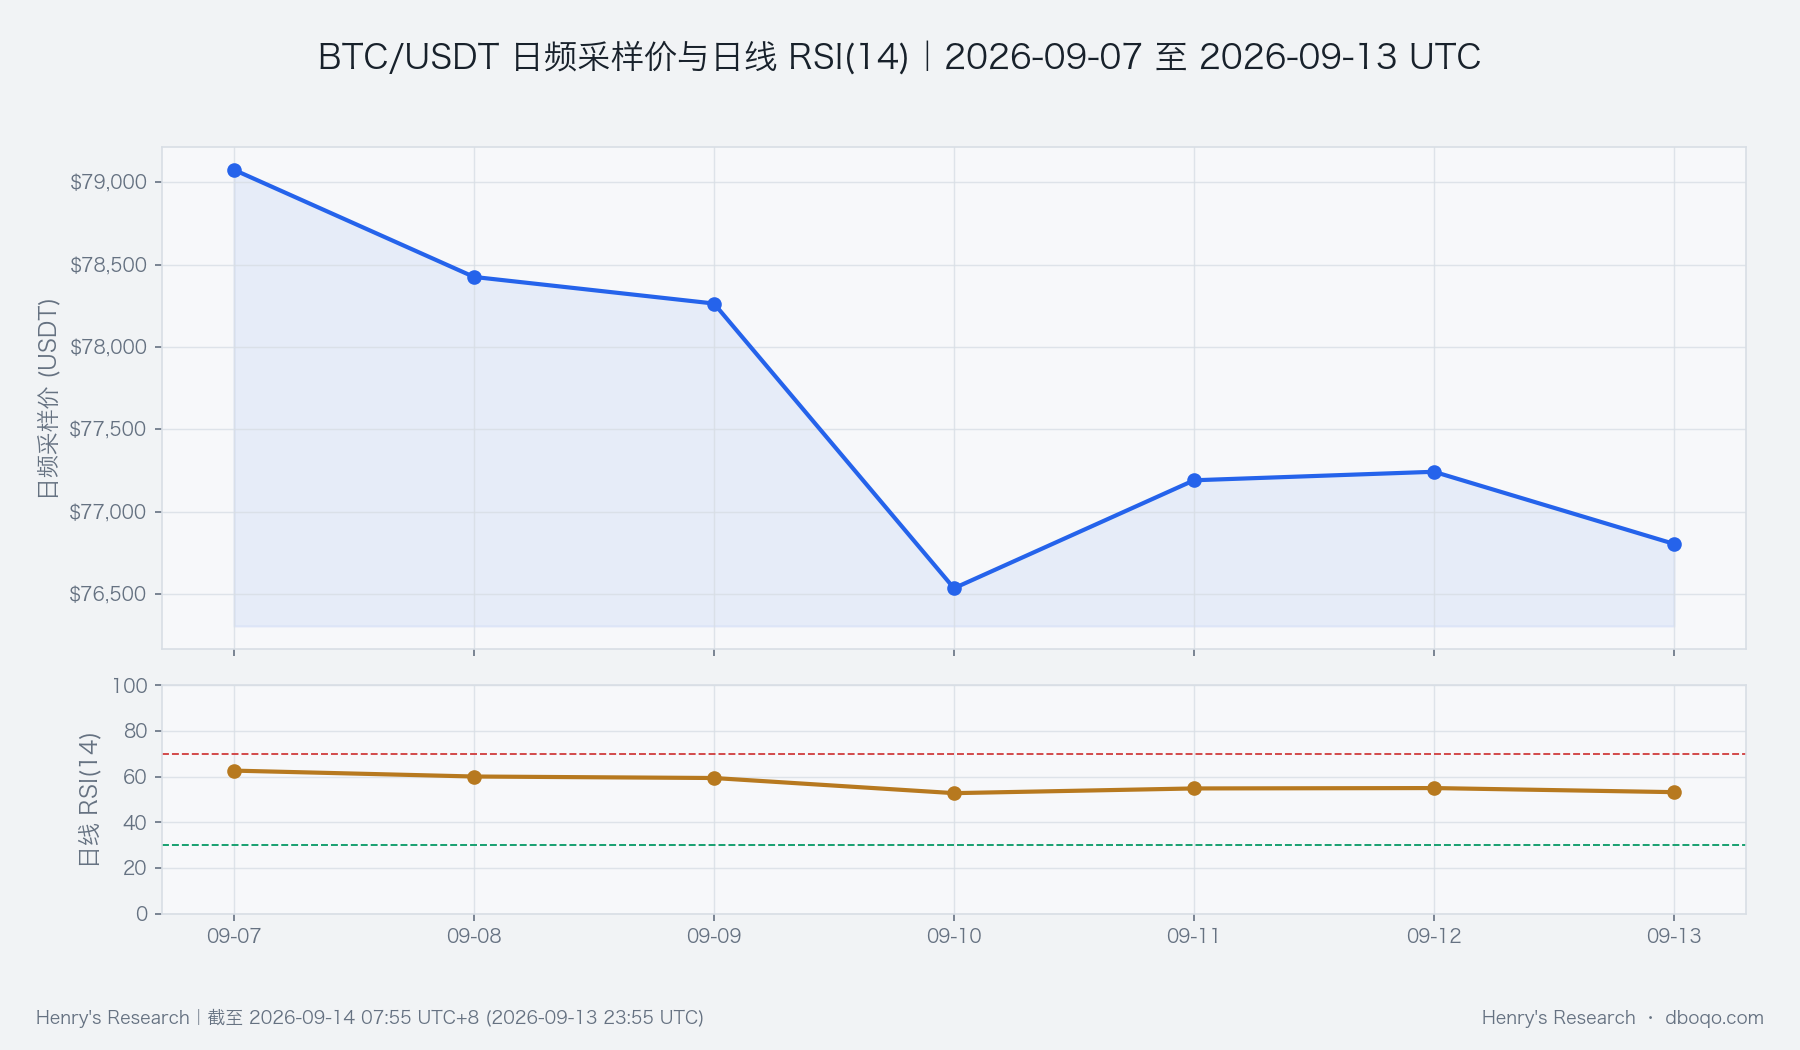
There is also counterevidence in the trend: daily RSI, an indicator of the relative strength of recent upward and downward momentum, still shows some resilience; declining momentum in the chart does not mean it has entered an extreme condition. However, the ending price was below the available short-term daily moving average of 78,768.08 USDT, meaning the repair still faces overhead constraints. This average uses completed daily data and the value available on 9/12 UTC (month/day), so it has a timing lag; next week, observe whether price can remain above the updated average rather than merely touching it intraday.
IV. Volume-Price Structure and Price Range: Active Selling Has Not Reversed, and the Rebound Needs Volume Confirmation
Active buying minus active selling is used to observe whether buyers or sellers are more actively driving trades. The cumulative weekly difference in the chart remained negative; it briefly improved during the price rebound before weakening again. This shows that this week's low trading activity was not accompanied by sustained active buying, supporting the main view that the rebound lacks durability. It describes trading behavior in the observed market and cannot infer total funds across all markets.
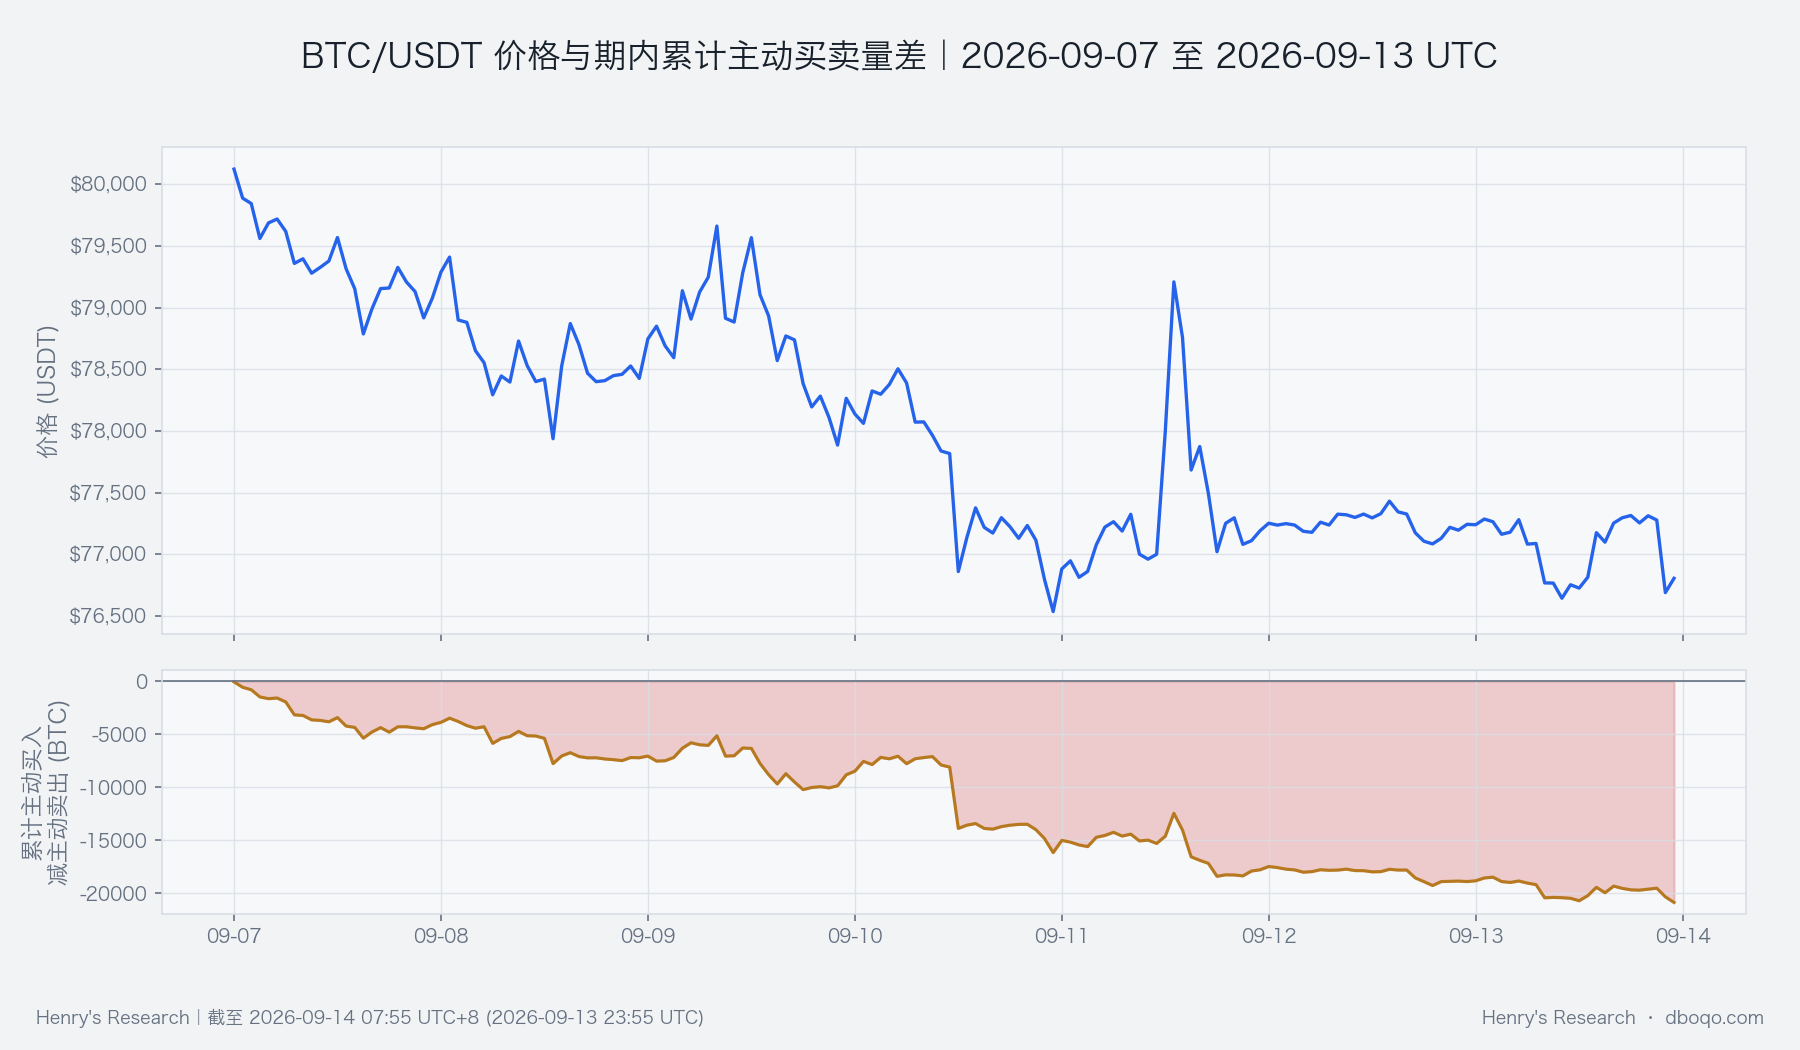
Next week, use this week's price range together with trading behavior: if cumulative selling pressure contracts near the lower bound and buying continues to increase during a recovery, the bearish assessment would be challenged; if the rebound still lacks active buying and price returns to lower levels, the original assessment would be supported. Range divisions only provide observation points; they do not create buying or selling demand, so a reversal cannot be declared merely because price reaches a certain proportional level.
V. Derivatives Changes: Long Bias Remains, but Has Not Received Spot Price-Volume Confirmation
Derivatives are not uniformly bearish. The ending long-short ratio was 1.66, indicating that the account sample covered by this ratio still leaned long; this reflects sample composition, not capital size, and cannot identify trader identities. Funding rates reflect the direction of periodic payments between long and short perpetual-contract positions, and remained positive overall during the week and close to historical norms; however, the futures-spot basis, the price difference between futures and spot, remained slightly negative. This divergence indicates that bullish sentiment has not translated into a broad price premium.
Therefore, the principal counterevidence from derivatives is that demand for a rebound may still exist, not that an advance has been confirmed. Only if long bias, active buying, and price recovery occur together next week would the assessment materially change; if only the long-short ratio rises while price cannot advance, the risk of unmet expectations warrants attention instead. The weekly average funding rate is not the cumulative cost of holding for the entire week, and the ending ratio cannot represent every point during the week.
VI. Cross-Market Conditions and Flows: Cooler Capital Conditions, with ETF Outflows Outweighing Medium-Term Supply Resilience
BTC's cross-market capital temperature was cool (-0.38), meaning the combined performance of ETFs, stablecoin supply, the U.S. dollar environment, and risk appetite was weak, consistent with the price and active-selling evidence. It is a composite temperature relative to historical conditions, not an outflow amount or probability of decline; dollar factors still provide some buffer, so cool conditions cannot be interpreted as simultaneous contraction across all funding channels.
The most direct pressure comes from ETFs: over the past 5 days, ETF flows, measured in hundreds of millions of US dollars, showed a net outflow of 4.76, versus a historical mean net inflow of 3.72. This was lower than about 75% of comparable weeks, placing it at a relatively low level. This indicates that the channel has recently not provided stable incremental support for recovery. Next week, watch whether subsequent disclosures improve consecutively; a single positive reading is insufficient to confirm sustained demand recovery. This is the ending value of a rolling window and cannot be repeatedly added up as a natural-week net flow.
Stablecoin supply provides a boundary: it contracted slightly in the short term, but still grew by 1.07% over 30 days, below the historical mean of 2.30%. This indicates that medium-term supply remains expanding, but at a relatively weak pace. Increased supply does not mean BTC has already been purchased; it would only strengthen the counterevidence if it appears alongside volume and price recovery. ETFs, stablecoins, and macro information each have daily updates and disclosure lags, while changes in cross-market linkage do not establish causality; these figures cannot explain every intraday move.
VII. Composite Signals and Next-Week Scenarios: The Bearish Consensus Holds, While Reversal Requires Joint Price and Flow Confirmation
The composite signal is bearish, consistent with weekly price weakness, active selling pressure, and cool capital conditions. Long bias in derivatives and resilience in daily momentum remind us that rapid rebounds may still occur during the period. This assessment concerns which side next week's environment favors, rather than asserting that price will fall every day or treating multiple related pieces of evidence as independent guarantees.
The baseline scenario is that rebounds remain constrained by moving averages and improving flows are insufficient to support a sustained recovery of lost ground; if price retests the weekly low while selling pressure expands, bearish evidence would strengthen. The opposing scenario is that price steadily reclaims short-term moving averages, active buying continues to increase, and ETF flows subsequently improve; then the original bearish confidence needs to be withdrawn. If price merely moves repeatedly within the range while volume-price and flow signals conflict, shift to awaiting confirmation rather than forcing consolidation to be interpreted as trend continuation.
VIII. Risk Notice
Historical means and relative positions describe the past and cannot guarantee the future. Low-turnover conditions may amplify price swings; correlations can change, and flow disclosures may be revised. Liquidations are measured daily and cannot be accumulated using repeated intraday values, much less treated as a certain causal relationship with concurrent price changes. This report does not construct causal explanations from news; if price, trading activity, or flows next week provide evidence contrary to these conditions, the conclusion should be reassessed promptly.
Disclaimer: This report is prepared by dboqo based on market data available through 2026-09-14 07:55 UTC+8. Cryptocurrency markets are highly volatile. This report is solely an objective analysis of market conditions and does not constitute any investment advice , and investors must assess risks independently and make prudent decisions.