I. Core Finding and Direction: VIX Pressure Is Rising, While the Rebound Has Yet to Reverse Cool Fund Flows
Data scope: As of 2026-09-15 09:20 UTC+8, the analysis covers the past 24 hours aligned with the cutoff time and compares them with 180 comparable periods sharing the same cutoff time; daily fund-flow data are interpreted according to their original reporting cycles.
Core finding: The expected U.S. equity volatility risk reflected by the VIX is at an unusually high level relative to recent norms. At the same time, stronger active net buying in BTC has not removed the constraints from a weakening short-term trend and cool fund flows. The tension is that buying can drive a rebound, but the funding environment does not yet support treating that rebound as a sustained advance.
Historical comparison: Relative VIX risk pressure is +1.92, versus a historical mean of -0.36; among 180 comparable periods, only about 9 were higher than the current reading, placing it at an unusually high level. This indicates relatively strong constraints on risk appetite. The next points to monitor are whether the pressure recedes and whether buying can continue to absorb selling pressure. This value measures relative pressure; it is not the VIX index level and does not indicate that the index has reached an all-time high.
Data-scope review: No potential anomalies were found in units, frequency, or magnitude; the VIX change is a statistical outlier. Daily fund-flow values are not repeatedly accumulated, and short-term trend indicators are not mixed with daily moving averages. No items currently need to be excluded from the directional assessment because of data-scope anomalies.
Directional assessment: Bearish, on a conditional basis. Assessment horizon: The next 24 hours. Conditions: Short-term moving averages remain under pressure, cross-market fund flows remain cool, and stronger buying has not produced a sustained rise in price. Invalidation conditions: Price holds above the short-term moving averages, active buying continues to improve, and fund-flow conditions strengthen; if these signals appear together, the bearish assessment should be withdrawn.
II. Key Market Data: Recovering Volume Makes the Rebound More Credible but Does Not Confirm a Reversal
BTC is quoted at 77,987.70 USDT, up +1.61% over the past 24 hours, versus a historical mean of +0.04%, ranking higher than about 84% of comparable periods. This is the most direct counterevidence to the current bearish assessment: price has already recovered, so rising risk pressure cannot be equated with an inevitable price decline. The key issue is whether the advance can be retained, rather than overstating the gains already recorded.
Trading volume was 165,415 BTC, versus a historical mean of 150,760 BTC, ranking higher than about 65% of comparable periods and slightly above normal. Participation is not weak, so low volume should no longer be treated as the main risk in this report. What must be verified is whether the recovered volume can translate into sustained buying. If volume holds while price weakens, active trading does not mean buyers have the advantage.
III. Price Action and Trend: Pressure on Short-Term Moving Averages Coexists With an Intraday Advance
The short-term moving-average spread is -228.79 USDT, versus a historical mean of +4.93 USDT; among 180 comparable periods, only about 7 were as low as or lower than the current reading, placing it at an unusually low level. Moving averages are smoothed price references, and a negative spread indicates that the faster price trend is weaker than the slower trend. Because its frequency differs from that of the full-day return, it can coexist with an intraday rebound; the advance alone cannot erase the trend constraint.
The daily short-term moving average of 78,179.23 USDT is above the current price and serves as a nearby reference for assessing whether the rebound can be retained. It is neither a guarantee of precise resistance nor a substitute for calculating the short-term spread described above. If price consistently holds above this reference while the short-term spread recovers, the bearish evidence will weaken. If the rebound repeatedly stalls, that would lend more support to the interpretation of post-rally consolidation.
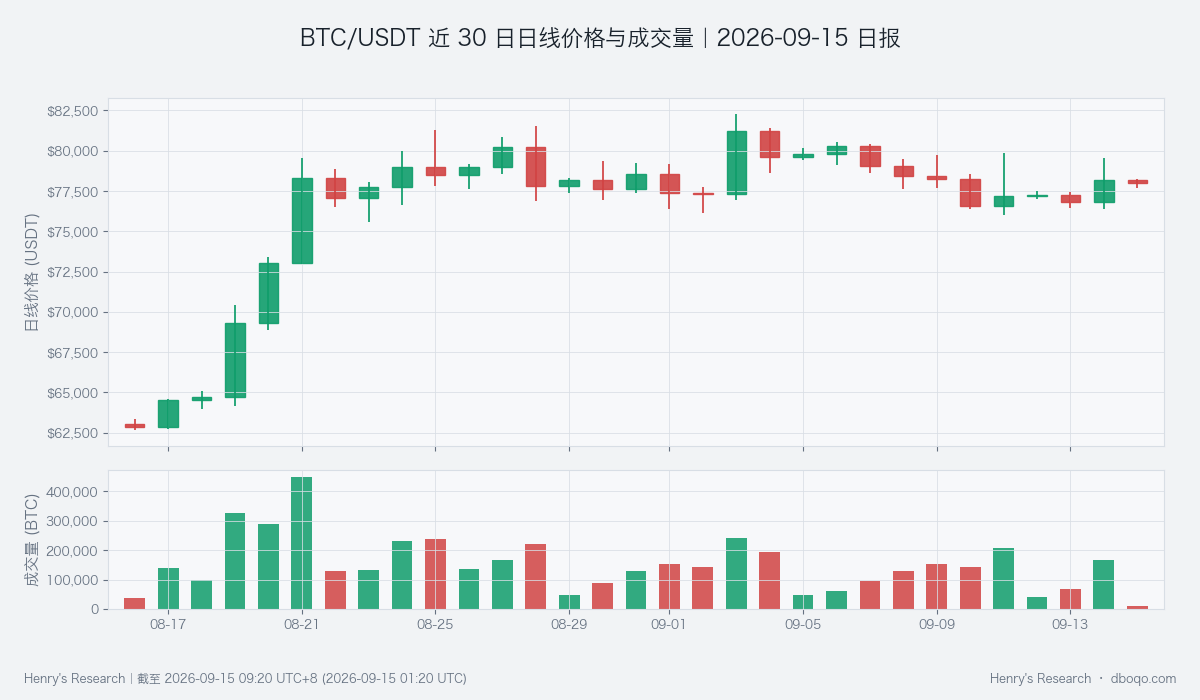
BTC/USDT daily price and volume over the past 30 days; the final day's data do not yet cover a complete trading day.
IV. Price-Volume Structure and Price Range: Active Net Buying Is the Main Counterevidence to the Bearish Assessment
Active net buying means active buying minus active selling. Its relative strength is +0.91, versus a historical mean of +0.02; among 180 comparable periods, only about 11 were higher than the current reading, placing it at an unusually high level. This shows that buyers are not absent and also means the bearish conclusion requires stricter price confirmation. The strength measure is a relative reading, not a U.S. dollar fund-inflow amount, and it cannot be added to ETF flows.
The price range over the past 24 hours was 76,609.70 to 79,570.90 USDT, and the current price has not held near the upper boundary. These two endpoints are used only to test how much of the rebound is retained. Continued buying accompanied by price moving back toward and holding near the upper boundary would contradict the bearish assessment. The original pressure scenario would receive stronger confirmation only if buying weakens and price falls below the lower boundary. A single touch does not confirm a breakout.
V. Derivatives Anomalies: Contract Costs Do Not Provide Independent Confirmation of Strength
Perpetual funding rates are used to observe the payment costs on the two sides of the contract market. A positive reading in the chart does not automatically imply a subsequent advance. The futures-spot basis measures the contract price relative to spot; it remains negative and close to its historical norm. Neither provides independent evidence strong enough to outweigh the moving-average and fund-flow constraints, so contract sentiment alone is insufficient to change the assessment from bearish to bullish.
This section tests whether improving buying is supported by derivatives rather than searching for additional figures pointing in the same direction. If contract pricing also continues to recover as price strengthens, the rebound interpretation will become more complete. If costs rise while price fails to advance, the durability of demand should instead be examined. Contract readings at different frequencies should not be combined into a single intraday fund-flow measure.
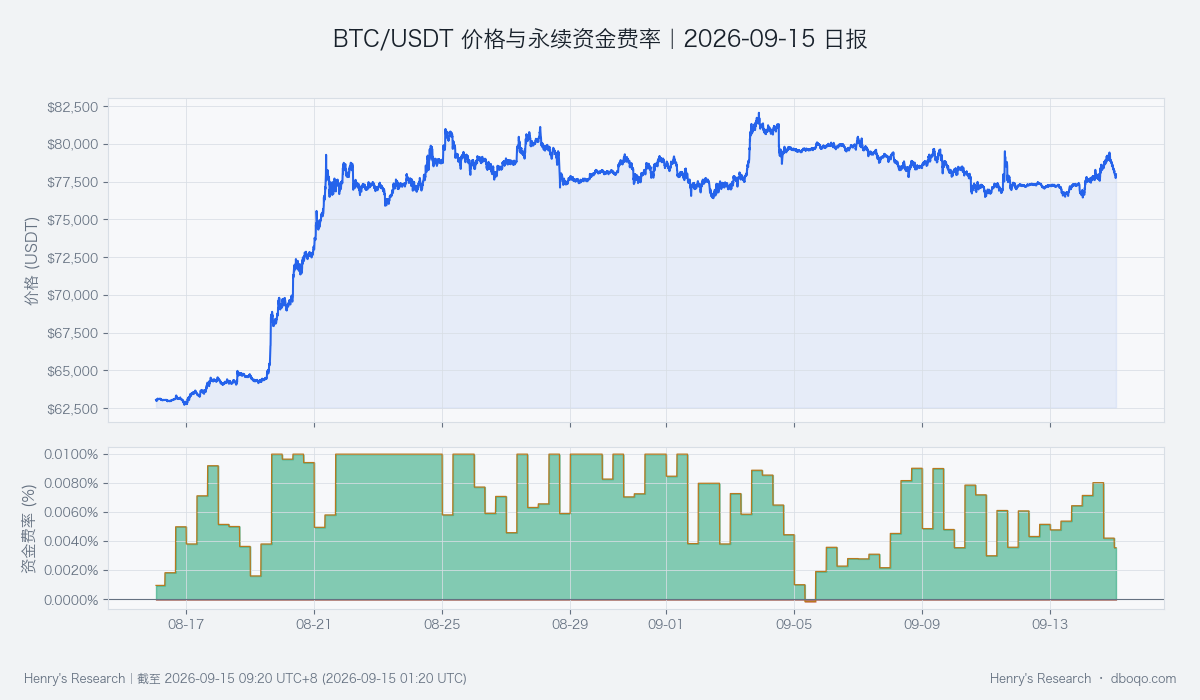
BTC/USDT price and perpetual funding rate over the past 30 days; the final day's data do not yet cover a complete trading day.
VI. Cross-Market and Fund Flows: Cool Funding Conditions Do Not Yet Support a Sustained Advance
BTC's cross-market funding conditions are cool: ETF outflows, weak short-term stablecoin supply, and risk factors from the U.S. dollar and VIX create constraints, while improving stablecoin supply over a longer period provides a partial offset. This is a composite description of several funding conditions. It does not prove that any single change directly caused BTC to rise or fall, nor does it mean that all funds have exited.
ETFs recorded net outflows of 3.22 hundred million U.S. dollars over the past 5 days, compared with historical mean net outflows of 0.11 hundred million U.S. dollars. The flow ranks lower than about 62% of comparable periods and is slightly below normal. This supports a cautious demand assessment but does not imply an extreme withdrawal. The next points to monitor are whether outflows narrow and whether short-term stablecoin supply and risk pressure improve together. Only when funding constraints ease is the recovery in buying more likely to persist.
VII. Composite Signals and Scenario Validation: A Bearish Consensus Holds, but the Durability of Buying Will Determine Whether It Is Invalidated
The composite signal is bearish, consistent with pressure on short-term moving averages and cool cross-market fund flows, but it conflicts with the current price advance and stronger active net buying. The baseline scenario is therefore pressured consolidation after the rebound, not an inevitable decline. The assessment should focus on whether price retains its gains and whether strong buying persists, rather than counting overlapping evidence more than once.
If price holds above the moving-average reference, active buying continues to strengthen, and fund-flow conditions improve, the baseline assessment would be invalidated and attention should shift to evaluating continuation of the advance. If price loses the lower boundary of the range while fund flows remain cool, the bearish assessment would be confirmed. If the two sets of evidence alternate while price stays within the range, directional confirmation remains insufficient and the possibility of range-bound trading should be retained rather than repeatedly changing the conclusion in response to short-lived fluctuations.
VIII. Risk Disclosure
Historical comparisons describe the current state's relative position, not the probability of future outcomes. The transmission of risk pressure to BTC can change, and fund-flow reporting cycles differ from continuous trading. Unexpected news may quickly invalidate the current conditions. Incomplete final-day volume in the charts should not be compared directly with full-day volume. This report discusses market conditions only, and the future direction must be continually tested against new price-volume and fund-flow evidence.
Disclaimer: This report was prepared by dboqo based on market data available as of 2026-09-15 09:20 UTC+8. Cryptocurrency markets are highly volatile. This report is solely an objective analysis of market conditions and does not constitute investment advice, and investors must assess risks independently and make prudent decisions.