One. Core findings and direction: VIX pressure aligns with a high-volume decline, while buying recovery creates a divergence
Data scope: As of 2026-09-16 09:20 UTC+8, this report examines the past 24 hours against 180 historical windows with the same cutoff time. Daily funding information is interpreted at its own frequency without repeated aggregation.
Core finding: The risk pressure associated with VIX, which reflects expected US equity volatility, is unusually elevated relative to its recent norm. BTC has simultaneously declined on increased volume, aligning risk constraints with weaker prices. Yet short-term aggressive buying has recovered, showing that selling is meeting some demand. The central question is whether that demand can persist, rather than whether the decline already recorded can simply be extrapolated.
Historical comparison: Relative VIX risk pressure is +2.59, against a historical mean of -0.35. Among 180 comparable periods, only about 3 were higher, an unusually elevated level. This makes the risk environment less supportive of sustained gains than usual. Watch whether pressure eases and prices stabilize as buying recovers. This comparison describes relative pressure, not the VIX index level, and does not imply an all-time index high.
Measurement check: No potential anomalies in units, frequency or scale were identified. VIX risk pressure and the long-short deviation are statistical outliers, rather than data errors. Intraday buying and the full-day price change measure different time horizons, so opposing directions do not establish a measurement problem. No item currently needs to be excluded from the directional assessment because of a measurement anomaly.
Directional assessment: Range-bound, with downside risk. Assessment horizon: The next 24 hours. Conditions for validity: Funding conditions remain cool, but short-term buying continues to absorb selling and prices do not sustain a breakout from the range. Invalidation conditions: Buying fades as the lower boundary breaks, or prices sustain a move above the upper boundary while funding conditions warm. Sustained confirmation of either combination would require reassessing the range-bound view.
Two. Key market data: The decline is unusually large, and higher volume has not established buyer control
BTC is at 75,908.70 USDT, with a 24-hour change of -2.67%, versus a historical mean of +0.07%. Among 180 comparable periods, only about 13 were equally low or lower, an unusually weak outcome. The decline therefore warrants more attention than ordinary fluctuations, but its historical position is not the probability of another decline in the next period. Watch whether prices retain their rebound from the lows rather than using the decline alone to decide whether the market is cheap or expensive.
Volume is 234,242 BTC, against a historical mean of 150,434 BTC, higher than about 89% of comparable periods. Increased participation alongside falling prices makes it difficult to attribute this decline solely to thin trading. Total volume, however, cannot distinguish buying from selling intent. Watch whether active trading coincides with prices ceasing to fall. Demand absorption becomes more convincing only when volume and price improve together.
Three. Price action and trend: A rebound from the lows exists, but full-day weakness remains
The 24-hour price range is 74,909.40 to 78,061.60 USDT, with the current price in its lower half. The lower boundary provides a reference for testing demand absorption, while the upper boundary helps identify whether the decline has been recovered. These are observed price boundaries, not guaranteed support or resistance. Repeated returns toward the lower boundary would show that the short-term recovery has not changed full-day weakness.
A rebound from the lows can coexist with a full-day decline. Short-term improvement can support a range-bound assessment without proving a trend reversal. Equally, full-day weakness does not rule out a rapid rebound. The most valuable new evidence would be sustained price improvement alongside persistent aggressive buying, rather than a momentary return to gains.
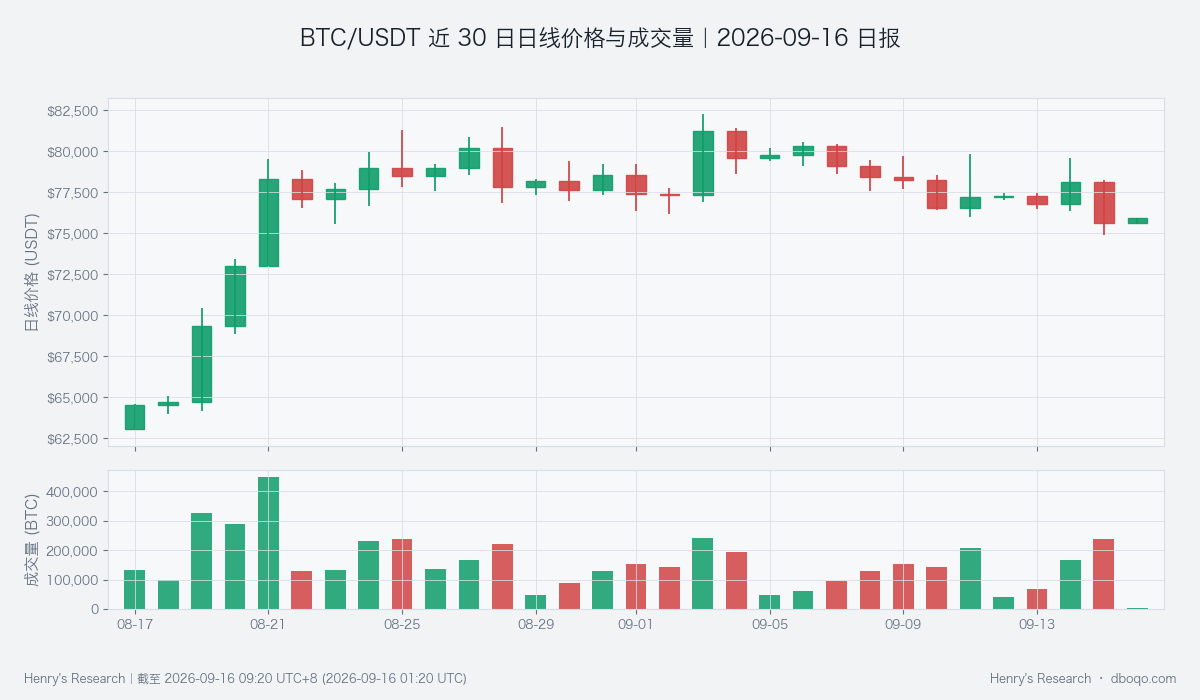
BTC/USDT daily price and volume over the past 30 days; the final day's volume does not yet cover a complete trading day.
Four. Price-volume structure and price range: Recovering aggressive buying challenges continued weakness
The rate of change in cumulative aggressive buys minus aggressive sells is +172 BTC, compared with a historical mean of -10 BTC. Among 180 comparable periods, only about 16 were higher, an unusually elevated level. This measure identifies the short-term direction of aggressive trading and indicates improving demand absorption, one of the strongest pieces of counterevidence to sustained weakness. It is neither a full-day net inflow nor an offset to selling pressure that has already occurred.
Whether this counterevidence develops into a sustained recovery must be tested against the price range. If buying persists and prices move progressively away from the lower boundary, the interpretation of demand absorption within a range becomes more credible. If buying weakens and prices return toward the low, the recovery may have been a temporary rebound. The chart's longer-period cumulative buying-selling difference provides context and should not be confused with the rate of change at the cutoff.
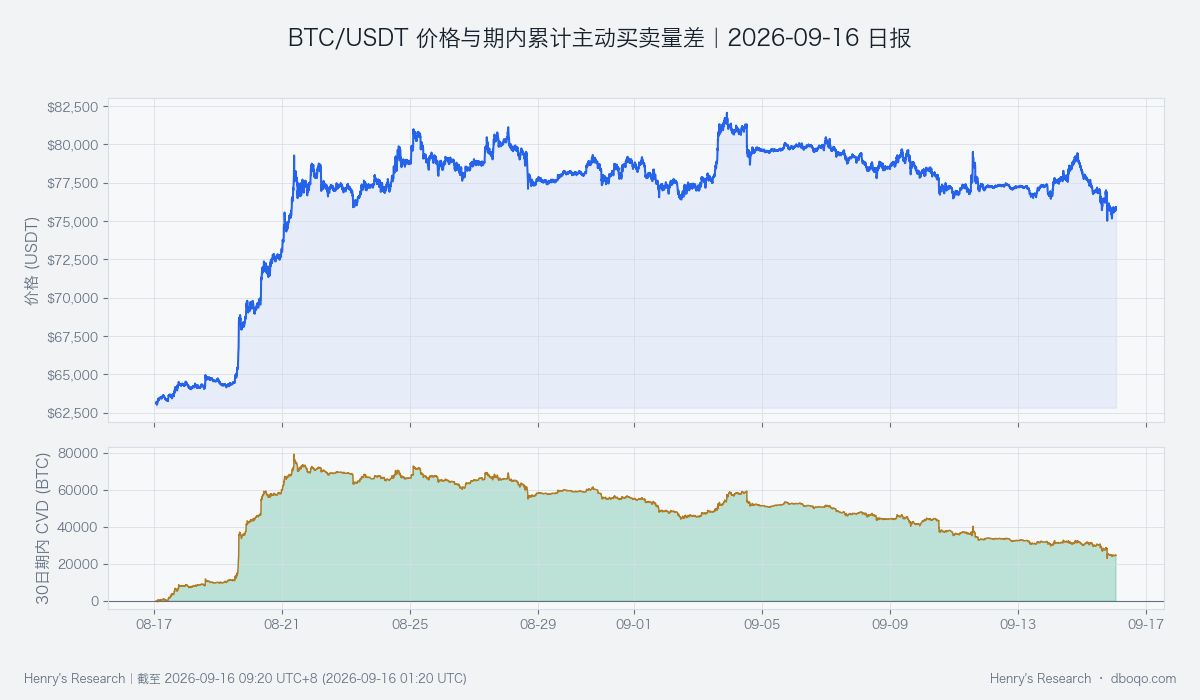
BTC/USDT price and cumulative aggressive buys minus aggressive sells over the past 30 days; short-term improvement still needs confirmation through price persistence.
Five. Derivatives developments: Elevated long-short deviation lacks price confirmation
The long-short structure's deviation from its own norm is +2.42, against a historical mean of +0.03. Among 180 comparable periods, only about 6 were higher, an unusually elevated level. Directional inclination is therefore more pronounced than usual. However, this measures relative deviation, not the long-short ratio itself or a net capital inflow. With prices still weak, that inclination cannot be treated as confirmation of an advance.
The bullish inclination in derivatives and the high-volume decline create a second divergence: expectations on one side and realized price outcomes on the other. If prices stabilize alongside buying, this gap may narrow. If prices keep weakening, the elevated inclination instead highlights the risk of disappointed expectations. The long-short deviation alone implies neither an inevitable rebound nor an inevitable reversal.
Six. Cross-market and funding conditions: The funding temperature is cool, and partial inflows do not remove constraints
The BTC cross-market funding temperature is cool. Aggregate ETF net inflows over recent trading days provide a cushion, but flow strength has not improved markedly. Weak short-term stablecoin supply and improving longer-term supply describe different funding horizons. Relative dollar strength and elevated VIX pressure remain constraints, so partial inflows cannot establish a broad recovery in risk appetite.
This evidence explains why caution remains necessary despite recovering buying: the funding environment is not fully supportive. It describes a combination of conditions and does not prove that any individual macroeconomic change directly caused BTC to fall. Watch whether ETF inflows persist, short-term stablecoin supply improves and risk pressure eases together. A price recovery becomes easier to sustain when those conditions improve jointly.
Seven. Composite signal and scenario validation: A bearish signal conflicts with recovering buying, keeping the baseline range-bound
The composite signal is bearish, consistent with the high-volume decline and cool funding conditions, but at odds with stronger short-term aggressive buying and an elevated bullish long-short inclination. The final assessment therefore remains range-bound with explicit downside risk. The composite signal is not a prediction of an inevitable decline, and opposing evidence must remain visible. The validation priority is whether these divergences narrow, rather than repeatedly counting the same risk factor.
If prices hold within the range and buyers and sellers alternate in control, the baseline remains valid. If buying weakens, the lower boundary breaks and funding conditions stay cool, reassess for bearish continuation. Conversely, sustained prices above the upper boundary, persistent buying and warmer funding conditions would weaken the market basis for the bearish signal and invalidate the range-bound view. A brief boundary crossing followed by a rapid return does not confirm a new direction.
Eight. Risk considerations
Historical samples describe relative positions, not future probabilities or guaranteed returns. Macroeconomic and funding data update at different frequencies from continuous trading, and unexpected news can rapidly change conditions. The chart's incomplete final-day volume cannot be compared directly with complete days, and short-term buying improvement can reverse. The assessment applies only to the stated horizon and must change as new price, volume and funding evidence emerges.
Disclaimer: This report was prepared by dboqo based on market data as of 2026-09-16 09:20 UTC+8. Cryptocurrency markets are highly volatile. This report provides only an objective analysis of market conditions and does not constitute investment advice. Investors should assess risks independently and make prudent decisions.