Core findings and outlook: Risk pressure and weak buying limit the quality of the rebound
Data scope: As of 2026-09-17 10:50 UTC+8, the current observation covers approximately 24 hours. The historical comparison uses 180 comparable windows with the same cutoff time. Daily and intraday indicators are interpreted separately; repeated observations are not added together as fund flows.
Core finding: The price has rebounded, but risk appetite and new buying have yet to strengthen in step. VIX reflects the US equity market’s expectations for future volatility, and its relative risk pressure is higher than in most comparable periods. At the same time, aggressive net buying is lower than in most comparable periods. This makes the price recovery look more like a rebound within a range than a confirmed shift to an upward trend.
Historical comparison: VIX-related risk pressure is +1.69, versus a historical mean of -0.35. Among 180 comparable periods, only about 13 were higher than the current reading, placing it higher than most comparable periods. This comparison concerns risk pressure relative to its own history, not the VIX index level, and does not mean the index has reached a new high. Elevated pressure means the rebound needs stronger follow-through from buyers. The next question is whether that pressure eases.
Data-scope review: No potential anomalies in units, frequency, or magnitude were found. The unusual historical position is a market observation, but it has not triggered a statistical anomaly determination in this report. An unusual reading alone does not establish panic or a data error.Directional assessment: Range-bound, with the rebound still at risk of coming under pressure.Assessment horizon: The next 24 hours.Conditions supporting the assessment: The price remains within its recent range, buying does not strengthen persistently, and liquidity conditions remain cool.Conditions that would invalidate the assessment: The price breaks convincingly above the range ceiling, confirmed by stronger buying and improved liquidity conditions; or it falls below the range floor while selling pressure continues to grow.
Key market data: A modest recovery has yet to receive strong confirmation
BTC/USDT stands at 76,326.20 USDT, up 0.57% over the past 24 hours. This exceeds the historical mean of 0.06% and is higher than about 67% of comparable periods. This is direct evidence against a one-sided bearish view: the price is recovering. Its historical standing is only slightly above normal, however, rather than a significant breakout. The next question is whether the rise is accompanied by sustained aggressive buying, rather than a brief increase in price alone.
Trading volume over the same period was 162,899 BTC, versus a historical mean of 150,520 BTC, higher than about 65% of comparable periods. Activity is sufficient to support repeated price tests, but does not represent an unusually large volume surge. Volume alone has no direction: the same level of activity may reflect buying support or selling into the rebound. The key is which side drives the trading.
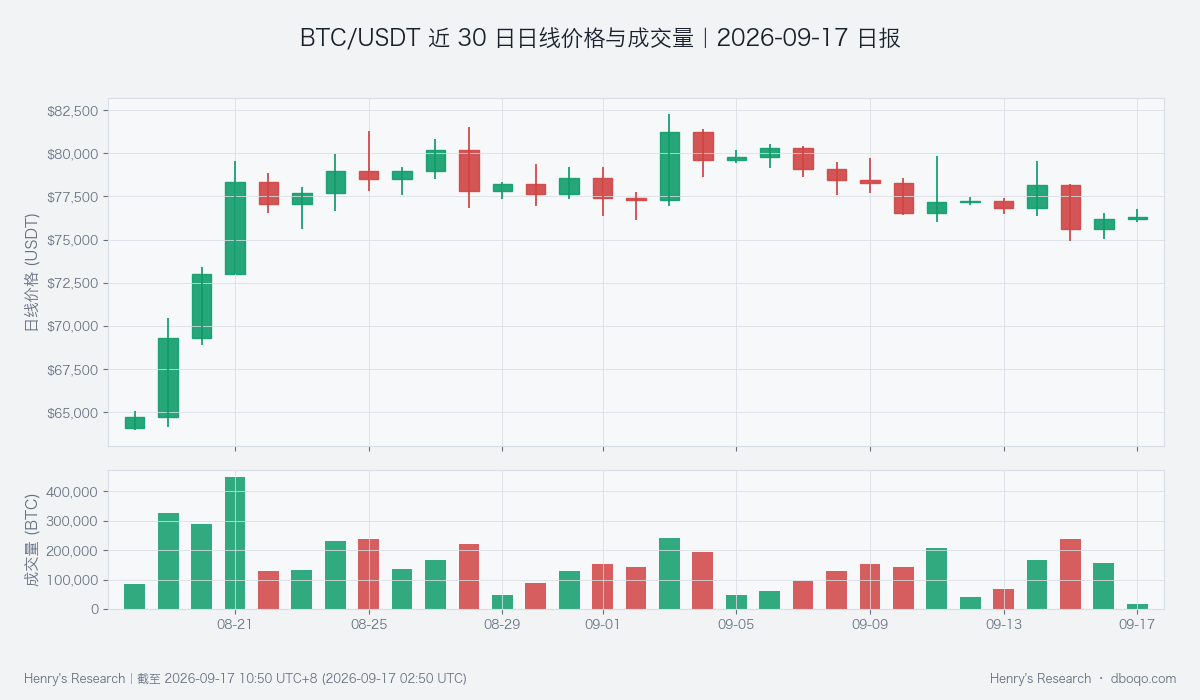
BTC/USDT daily price and volume over the past 30 days. The current day has not ended, so its latest volume bar cannot be compared directly with a full day.
Price action and trend: The range ceiling is a better test of strength than a single rise
The observed range over the past 24 hours is 75,025.00–76,749.10 USDT. Although the current price has moved off the low, it has not crossed the ceiling, so the rise does not yet establish a new upward trend. These prices come from the observed trading range and serve only as references for testing scenarios; they are not guaranteed to act as support or resistance.
If the price moves above the ceiling and stays there, it would suggest buyers are accepting higher prices. Aggressive buying should then be checked for a corresponding improvement. If repeated tests of the ceiling end in pullbacks, buying support for the rebound remains limited. If the floor gives way, the range-bound assessment must also be withdrawn and downside risk reassessed; subsequent price changes cannot all be explained as range trading.
Price and volume structure: Rising prices diverge from weak new buying
Aggressive net buying strength measures aggressive buying relative to aggressive selling. Its current reading is -1.13, versus a historical mean of +0.09. Among 180 comparable periods, only about 7 were as low or lower, placing it lower than most comparable periods. This is a relative-strength reading, not an amount of capital outflow, and it does not mean sellers dominated the entire observation period.
The significance is that the price rise lacks confirmation from strong new buying at the cutoff time. A rebound within the range may continue for a while, but this weakens confidence in an upside breakout. Because this reading reflects the cutoff time while the price change covers the full observation period, the divergence does not mean the data are contradictory. The next question is whether buying can recover consistently. If it improves only briefly before weakening again, price behavior near the ceiling warrants closer scrutiny.
Derivatives: Funding rates remain normal and do not strongly confirm the rebound
Perpetual funding rates are periodic payments between long and short contract holders and help indicate which side’s demand is stronger. The observed mean over the past 24 hours is +0.004655%, versus a historical mean of +0.003083%. Its relative position is near the historical middle. A positive reading indicates some bullish demand, but demand is not unusually crowded and does not establish that the rebound has lasting momentum.
This comparison uses the mean of observations on the same basis; it cannot be treated as a full-day accumulated payment or return. A more useful test is whether funding and price move together. If funding keeps rising while the price struggles to break out and aggressive buying remains weak, evidence of stronger demand is limited. If price and buying strengthen together, a moderate funding rate need not be interpreted on its own as a risk signal.
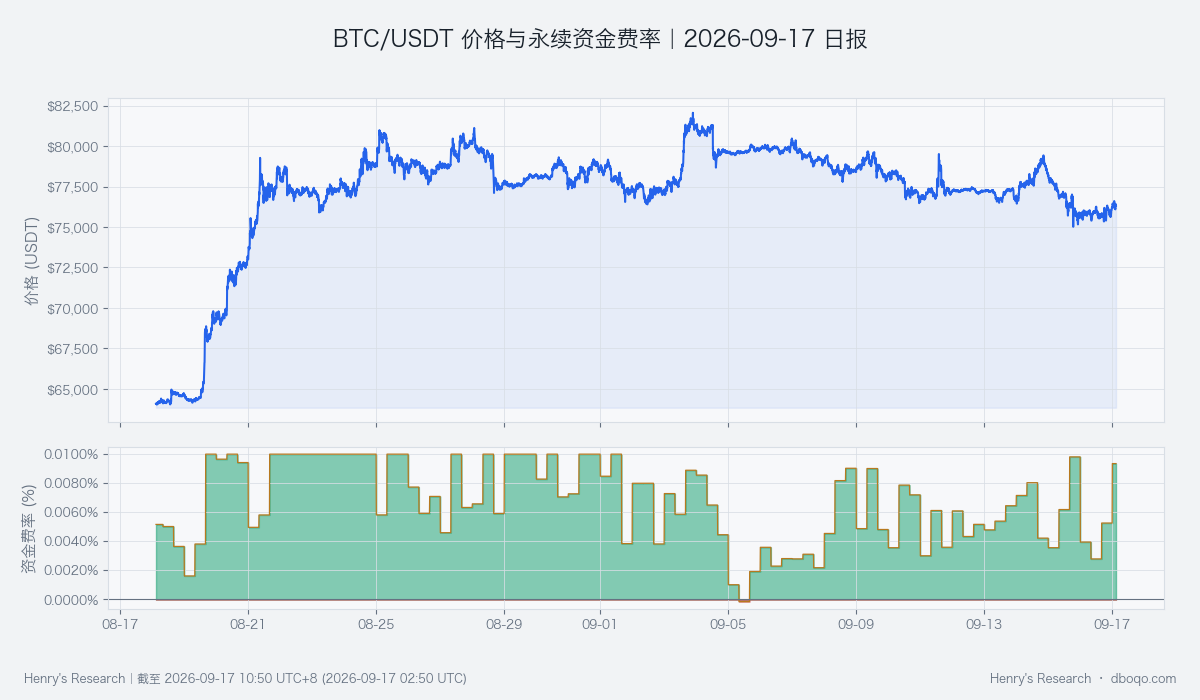
BTC/USDT price and perpetual funding rates over the past 30 days. Funding-rate readings are not equivalent to accumulated payments or returns.
Cross-market conditions and liquidity: Cool conditions leave the rebound with limited external support
Cross-market liquidity conditions for BTC are cool. ETFs have recorded net outflows over the past 5 days, short-term stablecoin supply has contracted, and supply over a longer period is still growing. A relatively strong US dollar and elevated VIX-related risk pressure further weaken the case for an easy funding environment. Taken together, these factors suggest the rebound currently lacks support from a broad improvement in liquidity.
This assessment describes the environment, not the destination of every fund flow, and it does not prove that macroeconomic factors must cause BTC to fall. Continued growth in stablecoin supply over a longer period is a reason not to describe liquidity as contracting across the board. Confirmation of broader improvement would require ETF flows, short-term supply, and easing macro pressure to support one another; improvement in a single measure is insufficient.
Composite signal and scenario tests: The bearish signal and price recovery have yet to align
The composite signal is bearish, broadly consistent with weak new buying and cool liquidity conditions, but at odds with the price recovery during the observation period. The final assessment therefore remains range-bound; a bearish signal does not mechanically mean the price must fall. The rebound is genuine counterevidence. Downside risk would gain further support only if rebounds repeatedly stall while weak buying persists.
The main scenario is continued movement within the recent range, with the quality of rebounds determined by whether buying follows through. An upside scenario requires a break above the ceiling confirmed by sustained buying and improving liquidity conditions; that would overturn the current view that the rebound remains under pressure. A downside scenario requires a break below the floor with sustained selling pressure; that would overturn the range-bound assessment. Until such evidence emerges, a single price move does not establish a trend.
Risks
Historical position describes how uncommon a reading is within the sample, not the probability of a future rise or fall. Short-term trading, cross-market volatility expectations, and liquidity supply update at different rates, while unexpected news can quickly change their relationship. Range boundaries may be crossed briefly, and individual signals may reverse. The assessment should be reviewed as price, aggressive buying, and liquidity conditions evolve, and revised when its conditions no longer hold.
Disclaimer: This report was prepared by dboqo using market data available as of 2026-09-17 10:50 UTC+8. Cryptocurrency markets are highly volatile. This report is solely an objective analysis of market conditions and does not constitute investment advice, and investors must assess risks independently and make decisions with care.