One. Core findings and direction:Dollar pressure is elevated, while aggressive buying supports conditional upside
Core finding: BTC is recovering, but funding conditions have yet to warm in parallel. Relative dollar pressure and aggressive net buying are both unusually high, creating the central tension: buyers are willing to initiate transactions, but must still prove that demand can absorb overhead supply. The advance is therefore best understood as a conditional recovery, rather than an established new trend.
Data context: As of 2026-09-18 09:15 UTC+8, current price and turnover cover the preceding 24 hours. Historical comparisons use 180 comparable periods with the same cutoff time. Lower-frequency funding indicators retain their original observation windows, without adding repeated observations together.
Historical comparison: Relative dollar pressure is +2.68, against a historical mean of +0.17. Only about 6 of 180 comparable periods were higher, placing it at an unusually high level. This measures the dollar's strength relative to its own normal conditions; it is neither the dollar index level nor evidence of an all-time high. Aggressive net buying strength is +0.96, against a historical mean of -0.09. Only about 7 of 180 comparable periods were higher, also an unusually high level. The former points to an external constraint, while the latter suggests immediate demand can still provide support. The next test is whether buying persists rather than appearing as a brief pulse.
Measurement check: Checks of units, frequency and scale found no measurement-anomaly candidates. Unusual historical levels do not imply bad data, and no statistical-anomaly threshold was triggered this period. Relative-strength readings are not monetary amounts and must not be interpreted as the size of inflows.
Directional judgment: Bullish, conditional on a cool funding backdrop. Assessment horizon: The next 24 hours. Conditions for validity: Aggressive buying persists, trading participation improves, and price holds the recent range floor while gradually reclaiming overhead moving averages. Invalidation conditions: Buying weakens and price breaks below the range floor, or dollar pressure intensifies alongside contracting funding conditions. Either development would warrant withdrawing the bullish view.
Two. Key market data:A modest advance still lacks sufficient turnover confirmation
BTC/USDT is 76,551.20, up +0.30% over the preceding 24 hours, versus a historical mean return of +0.06%. The return remains within its usual historical range. This indicates some price recovery, but is not strong enough on its own to establish a trend reversal. Attention should focus on whether further gains attract sustained turnover, rather than treating a modest rebound as a broad return of demand.
Turnover was 117,952 BTC, versus a historical mean of 150,368 BTC, lower than about 67% of comparable periods and somewhat below normal. Weak turnover makes the unusually firm aggressive buying more dependent on subsequent confirmation: a shift in buying intent can precede broader participation, but can also fade when supply increases. If price continues to rise without better turnover, confidence in the bullish view will decline.
Three. Price action and trend:Overhead moving averages still constrain the short-term recovery
Price remains below the 10-day moving average of 77,077.80 and the 30-day moving average of 77,658.95. These averages summarize price levels over shorter and longer daily windows; the current ordering indicates that the short-term rebound has not removed broader pressure. Stronger aggressive buying is a starting point for recovery, while a sustained move back above the moving-average region would offer more convincing confirmation.
The next test is whether demand continues to absorb supply as price approaches the averages, rather than whether price briefly touches them intraday. Repeated rejection there would suggest aggressive demand is still insufficient to absorb supply. Holding above them with orderly turnover on pullbacks would allow the tension between dollar pressure and price recovery to ease in buyers' favor. These are scenario-validation boundaries, not inevitable price targets.
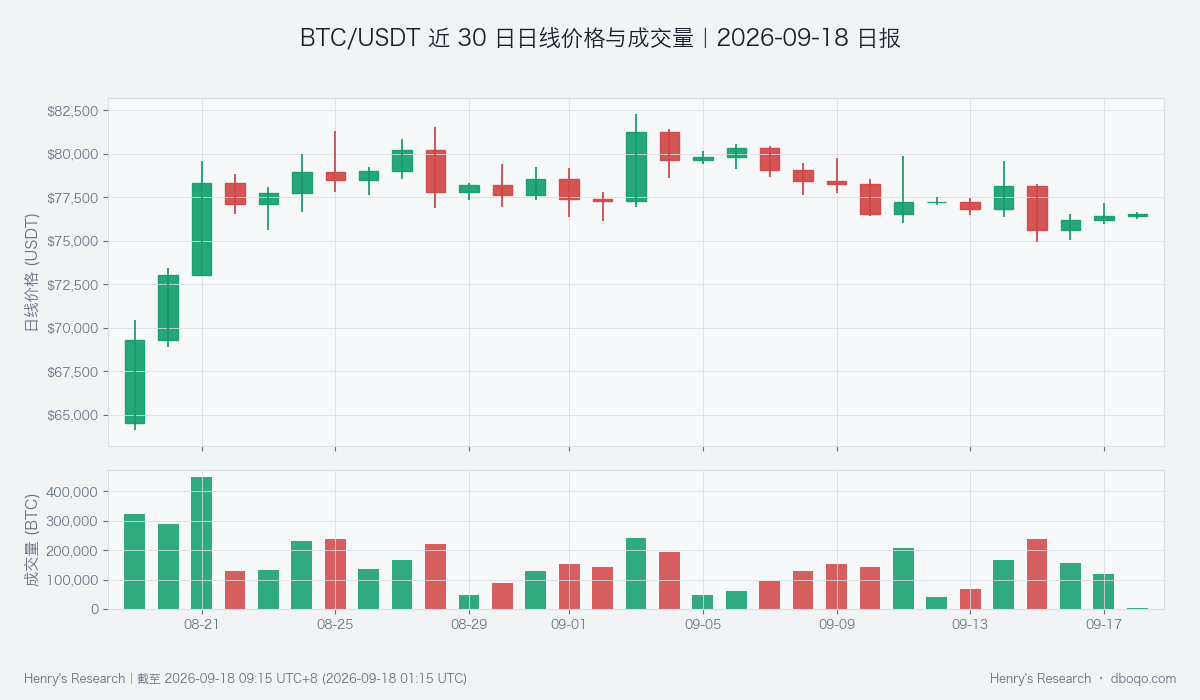
BTC/USDT daily price and turnover over the past 30 days; assess whether turnover confirms the price recovery.
Four. Price-volume structure and price range:Stronger buying needs validation above the range ceiling
Aggressive net buying measures the relative strength of buyer-initiated volume minus seller-initiated volume. It reflects the intent of transaction initiators, rather than external net capital inflows. Strong buying is the main evidence supporting the bullish view. Its coexistence with weak overall turnover, however, means that buyers' advantage has yet to translate into broad participation and does not establish a sustained breakout.
The preceding 24-hour range is 75,975.00 to 77,149.80 USDT. The floor tests whether support remains, while the ceiling tests whether aggressive demand can take price out of consolidation. A breakout above the ceiling on stronger turnover, followed by support on a pullback, would improve the recovery's credibility. If the buying advantage disappears and the floor gives way, the bullish case loses its most direct price support. Range boundaries can be crossed briefly, so the persistence of turnover matters as well.
Five. Derivatives developments:A low options volatility spread signals a gap between expectations and realized movement
Implied volatility reflects expectations embedded in option prices, while realized volatility measures price fluctuations that have already occurred. Their difference helps assess the distance between expectations and actual movement. The current spread is -8.42, against a historical mean of +0.55. Only about 9 of 180 comparable periods were equally low or lower, an unusually low level. This indicates a pronounced gap between the two volatility measures, but does not directly predict whether price will rise or fall.
This finding defines a risk boundary and cannot replace confirmation from buying and price. If realized volatility expands again while turnover remains thin, both breakouts and reversals could develop more quickly. If the two volatility measures converge, the gap may ease naturally. The funding-rate chart shows the payment bias in perpetual markets; its direction alone cannot establish that new demand has arrived.
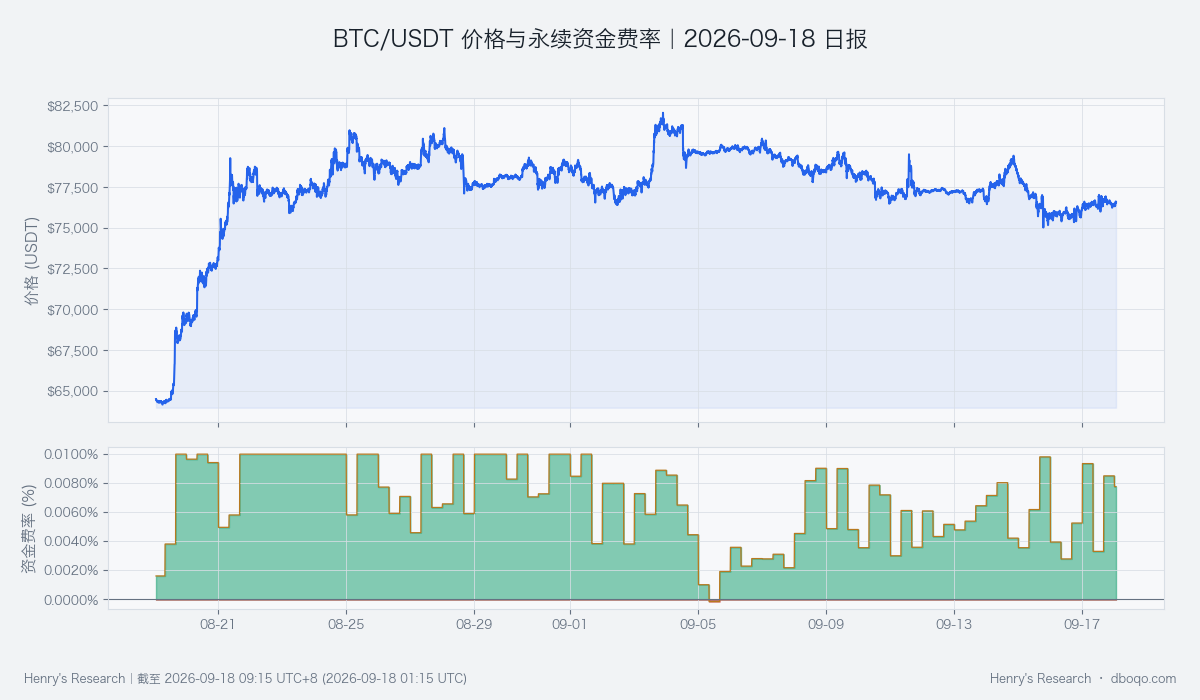
BTC/USDT price and perpetual funding rates over the past 30 days; interpret payment bias alongside price and turnover.
Six. Cross-market conditions and capital flows:Cool funding conditions remain the main counterargument to the bullish view
BTC cross-market capital temperature is cool, indicating that ETFs, stablecoins, the dollar and volatility factors have yet to provide a common tailwind. ETFs recorded net outflows of 6 hundred million US dollars over the past 5 days, suggesting this channel is not currently providing sustained support; the next test is whether outflows narrow. Stablecoin supply is contracting over the shorter window while still growing over the longer window. Available funding conditions are therefore mixed and cannot be equated directly with purchasing power entering BTC.
Elevated relative dollar pressure is a constraint, while the VIX factor, reflecting expected US equity volatility, does not show risk pressure of comparable intensity. Overall, capital-flow evidence and aggressive buying do not point in the same direction. Even if short-term prices strengthen, easing outflows or reduced dollar pressure would be needed to improve confidence in a durable recovery. These relationships are conditional, not proof of causation.
Seven. Combined signal and scenario validation:The bullish view aligns with price and buying but conflicts with funding conditions
The combined signal is bullish, consistent with stronger aggressive net buying and the short-term price recovery, but at odds with cool capital temperature and daily moving averages that remain overhead. This structure supports a conditional upside assessment, not an interpretation that all evidence confirms the same direction. The key test is whether stronger buying intent translates into persistent turnover and a firmer price position.
Improving turnover, a confirmed recovery above the range ceiling and no further increase in dollar pressure would support the bullish scenario. Continued sideways movement with fading buying would call for lower directional confidence. A break below the floor, weaker buying and further cooling in funding conditions would be sufficient to overturn the current assessment. A macroeconomic factor changing in isolation is insufficient; price and turnover must confirm that its influence is transmitting to the market.
Eight. Risk considerations
Historical comparisons locate current market conditions and cannot be converted into the probability of future gains. Intraday buying, daily moving averages and lower-frequency funding data use different observation windows, so signals may change at different times. Historical positioning also changes as observations arrive. The options volatility spread has no standalone directional meaning, and unexpected events may quickly invalidate the current range. Continue testing the stated conditions rather than extending this assessment into a long-term conclusion.
Disclaimer: This report was prepared by dboqo using market data as of 2026-09-18 09:15 UTC+8. Cryptocurrency markets are highly volatile. This report provides objective analysis of market conditions only and does not constitute investment advice. Investors should assess risks independently and make prudent decisions.