I. Core finding and direction:Weak aggressive net buying, with improving capital conditions yet to reverse pressure
Data context: As of 2026-09-20 09:15 UTC+8, this report examines the latest 24 hours aligned with the cutoff. Historical comparisons use 180 comparable 24-hour samples with the same cutoff time; lower-frequency capital data retain their respective observation windows.
Core finding: Sideways prices conceal insufficient buying demand: aggressive net buying strength has fallen to a rare low, and thin turnover amplifies that weakness. Improving external capital conditions nevertheless mean that a bearish bias should not be read as confirmation of a one-way decline. Aggressive net buying measures the strength of buyer-initiated relative to seller-initiated activity. The current reading points more toward seller dominance than a fresh wave of demand.
Historical comparison: Relative aggressive net buying strength is -2.29, against a historical mean of -0.10. Among 180 comparable periods, only about 5 were as low or lower, making this a rare low. This is the most important unusual market reading in this report: stable prices do not necessarily mean ample buying demand. The next test is whether aggressive demand improves persistently, rather than whether prices merely turn positive.
Measurement review: No potential anomalies in units, frequency or scale were identified. The strength reading above is dimensionless, rather than a BTC quantity or a percentage price decline. Unusual market readings must be distinguished from data errors; no measure was excluded from the directional assessment because of a measurement anomaly.
Directional assessment: Bearish. Assessment horizon: The next 24 hours. Conditions for the view: Aggressive demand stays weak, turnover fails to recover, and prices cannot break decisively above the recent high. Invalidation conditions: Prices hold above the upper range boundary on stronger volume while aggressive buying improves persistently. Broader capital support would also require reassessing the bearish conclusion.
II. Key market data:Sideways prices and thin volume do not imply balance
BTC/USDT is at 81,160.80, up +0.03% over the latest 24 hours. The price change is close to the historical middle range, meaning price alone has not confirmed a direction. Turnover is 68,045 BTC versus a historical mean of 151,078 BTC. Among 180 comparable periods, only about 18 had equally low or lower turnover, making this a rare low. Thin trading means relatively little capital may move prices, so the apparent stability of the range deserves less confidence.
The point is not to interpret low volume as bearish by itself, but to consider it alongside weak aggressive demand. With limited new participation, an upward move needs stronger evidence of buying support, while a downward test could accelerate if demand is insufficient. Watch whether turnover expands when prices leave the range; a single crossing has limited explanatory value if activity remains thin.
III. Price action and trend:Holding the recent range does not yet establish further upside
Prices have ranged between 80,875.00 and 81,933.90 over the latest 24 hours. These boundaries test whether the current consolidation can persist; they are not guaranteed support or resistance. A break below the lower boundary with continued weak aggressive demand would reinforce downside pressure. A sustained hold above the upper boundary accompanied by recovering turnover would provide stronger evidence against the bearish view.
Prices remain above the area occupied by recent daily moving averages, suggesting the broader price recovery has not fully broken down. That does not eliminate insufficient short-term demand. The daily background and intraday buying support answer different questions: the former describes the existing price structure, while the latter determines whether fresh demand can sustain further gains. This report therefore makes a conditional short-term assessment rather than elevating consolidation into a trend reversal.
IV. Price-volume structure and price range:A local recovery in buying still needs persistence
The latest cumulative trend of aggressive buying minus aggressive selling has turned slightly positive, providing local evidence against the weak-demand thesis. Its historical position remains ordinary, however, and does not yet offset the rare low in aggressive net buying strength. These measures capture different observation scales: a brief recovery can coexist with insufficient overall demand. Selecting one reading should not mean ignoring the other.
The focus should be whether subsequent price action validates this improvement. If stronger buying persists during pullbacks and helps prices approach the upper range boundary again, the weakness hypothesis would be challenged. If buying improves only briefly and prices return to the lower part of the range, sustained demand would still be missing. The range identifies where to test the view; the relationship between price and volume determines whether a breakout is credible.
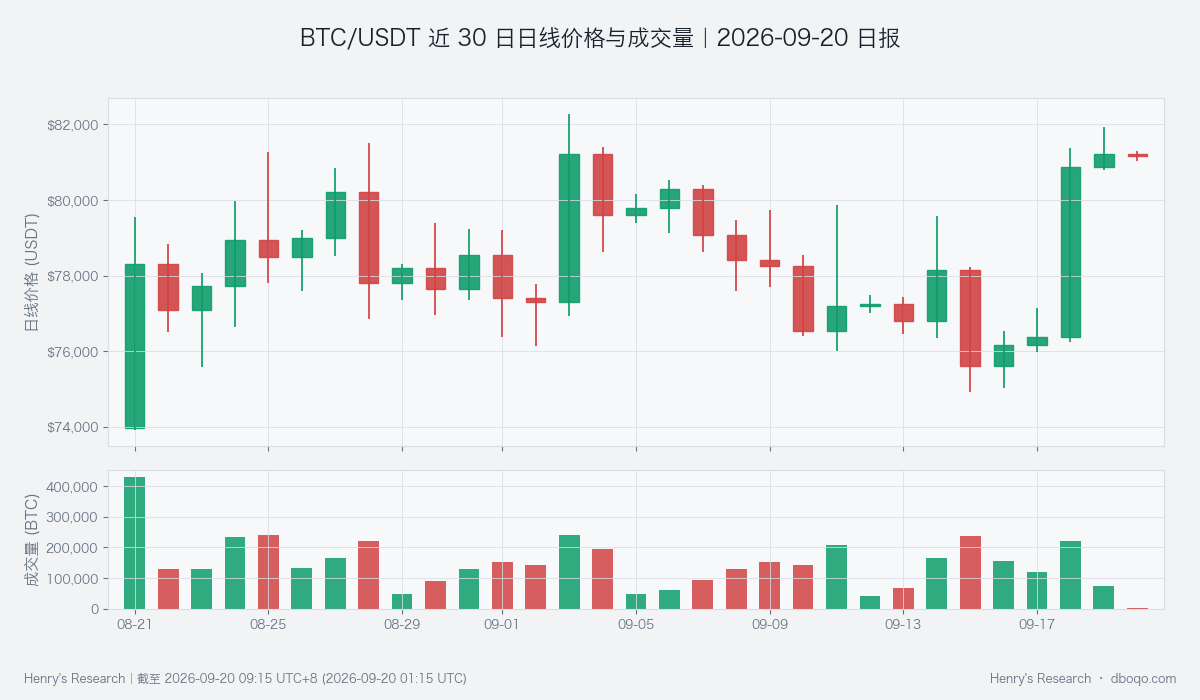
BTC/USDT daily price and volume over the latest 30 days
V. Derivatives developments:Elevated funding costs have not produced price expansion
The funding rate is a periodic payment between the two sides of a perpetual contract and helps gauge demand imbalances. The current 24-hour average is +0.009068%, versus a historical mean of +0.003206%. Among 180 comparable periods, only about 8 were higher, making this an unusually high reading. It indicates that the bullish side still bears positive funding costs, while prices have barely moved over the same period. That willingness has not yet translated into sustained price momentum.
This is an elevated historical ranking, but it has not independently crossed the threshold for a statistically unusual move, and it cannot establish that liquidations or a sharp decline are imminent. If funding remains high while aggressive buying stays weak, the basis for further upside becomes more fragile. Lower funding costs alongside stable prices and recovering buying could instead signal structural improvement. Watch the combination rather than treating the sign of funding as a price instruction.
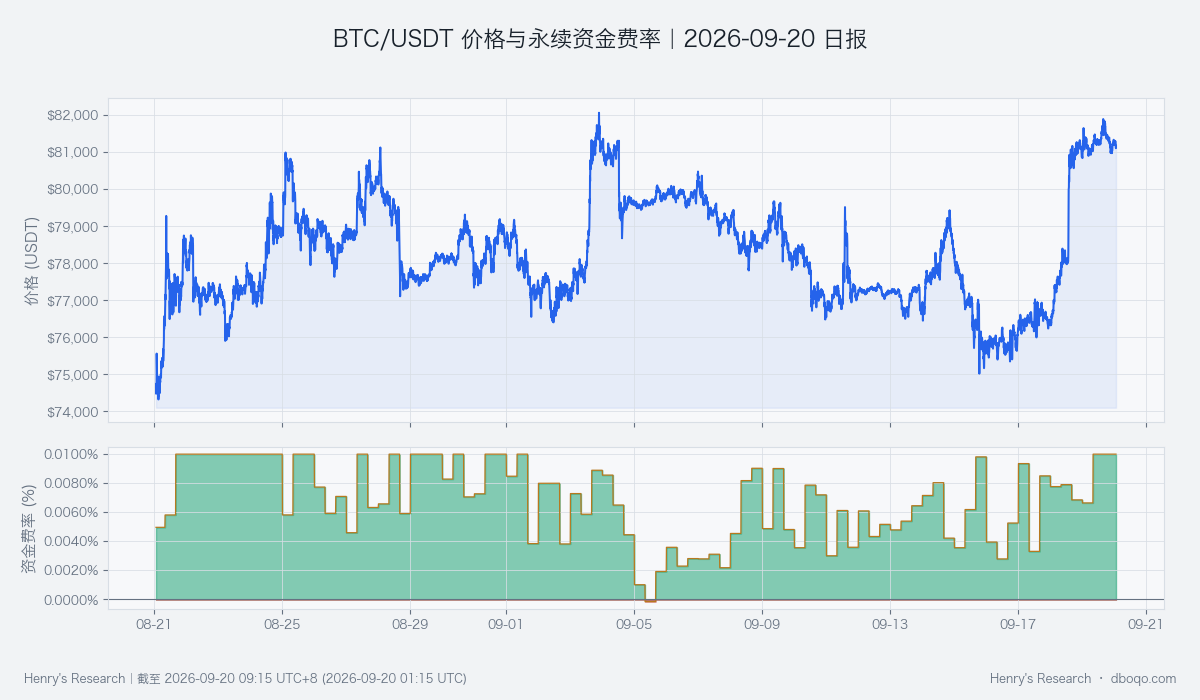
BTC/USDT price and perpetual funding rate over the latest 30 days
VI. Cross-market conditions and capital flows:A neutral capital pulse limits the bearish thesis
The BTC cross-market capital pulse is neutral, providing important counterevidence to weak price-volume conditions. ETFs recorded net inflows of USD 2.79 hundred million over the latest 5 days, indicating net support through that channel. This does not mean those funds bought during the current trading session. Short-term stablecoin supply is still contracting slightly, while the longer observation window shows growth, so improvement remains uneven. Relative dollar pressure is elevated, whereas the VIX risk factor, reflecting expected US equity volatility, has not deteriorated in parallel.
These factors offset one another. Capital conditions neither confirm a sustained decline nor guarantee an upside breakout. Watch whether ETF inflows persist, short-term stablecoin supply improves, and dollar pressure eases. If these conditions improve together, weak price-volume conditions may be absorbed. Inflows through only one channel still require confirmation from actual BTC buying demand.
VII. Combined signal and scenario tests:Bearish demand evidence contrasts with neutral capital conditions
The combined signal is bearish, consistent with weak aggressive demand and insufficient turnover. It is not fully aligned with the neutral capital pulse, and prices holding within the range have not yet confirmed a downward move. The baseline scenario is therefore constrained short-term upside with a risk of a downward test, rather than an interpretation that every piece of evidence is uniformly bearish.
A break below the lower range boundary with demand still weak would strengthen the bearish scenario. If prices remain inside the range, sideways trading remains possible; the passage of time alone should not increase confidence. A sustained move above the upper boundary on stronger volume, a persistent recovery in aggressive buying, or improved capital conditions translating into actual turnover would overturn the current bearish view. Confirmation requires price and demand to reinforce each other; a single price move is insufficient.
VIII. Risks
Historical rankings describe rarity within past comparable samples, not future price probabilities. Thin trading may amplify brief price shocks, and macroeconomic or unexpected news may quickly invalidate the conditions. Capital channels update at different frequencies, so lower-frequency flows should not be equated with immediate trading. This report discusses observed market conditions and conditional boundaries without presuming a certain outcome.
Disclaimer: This report was prepared by dboqo using market data as of 2026-09-20 09:15 UTC+8. Cryptocurrency markets are highly volatile. This report is an objective analysis of market phenomena only and does not constitute investment advice. Investors should assess risks independently and make prudent decisions.