I. Core finding and direction: stronger equity linkage leaves the bullish view dependent on volume
Core finding: As BTC strengthens, its tendency to move with US equities has also reached a rare high. Sustaining the advance therefore depends more on broader risk sentiment; stronger linkage is not itself bullish evidence. The price recovery supports further gains, but limited trading participation and neutral capital conditions mean that a bullish view still requires follow-through buying.
Data scope: Market data as of 2026-09-21 09:15 UTC+8 cover the past 24 hours and are compared with 180 historical windows aligned to the same cutoff. Correlation uses the rolling 30-day observation at each cutoff. Historical comparison: BTC’s correlation with US equities is +0.346, versus a historical mean of +0.060. Among 180 comparable periods, approximately 0 had a higher reading, placing it at a rare high. This indicates stronger recent co-movement, not perfect synchronization or evidence of which market drives the other. The next test is whether BTC can hold support if risk sentiment weakens.
Measurement review: There are no measurement-anomaly candidates this period. Stronger linkage is a statistical anomaly. Volume is accumulated over the current window, while lower-frequency capital data retain their original windows; repeated observations are not counted as new flows. Directional judgment: Bullish. Judgment horizon: The next 24 hours. Conditions for validity: Price remains in the upper part of the range, a breakout is supported by expanding volume, and cross-market conditions do not cool. Invalidation conditions: A failed breakout is followed by a sustained retreat, or worsening risk sentiment coincides with fading buying; either would weaken the bullish case.
II. Key market data: prices rise, but trading participation remains limited
BTC is at 81,796.10 USDT, up +0.78% over 24 hours, above the historical average gain of +0.10% and higher than approximately 72% of comparable periods. Price performance has improved, but a single day’s gain cannot establish a sustained trend. The focus should shift from whether price is rising to whether the advance attracts more participants. Without follow-through volume, the upper end of the range may remain an area of repeated contention.
Turnover is 107,532 BTC, versus a historical mean of 149,859 BTC, lower than approximately 72% of comparable periods and somewhat below normal. This is an important constraint on the bullish view: cumulative trading activity remains limited as price approaches the high. Low volume is not a sell signal by itself, but it reduces confidence in extrapolating the advance into a lasting breakout. Watch whether subsequent comparable windows recover toward normal activity.
III. Price action and trend: proximity to the high helps, but a breakout remains unconfirmed
The 24-hour price range is 80,095.90 to 81,815.50 USDT, with the latest price near the upper boundary. The recovery has brought price back to a strong part of this window. The upper boundary tests subsequent demand, while the lower boundary helps assess whether the range has broken down; neither is a precise level that must trigger a reversal. Repeated rejection near the high could turn short-term strength into range consolidation.
Price remains above recent short- and medium-term daily moving averages, consistent with a bullish direction. Daily positioning and a short-term breakout answer different questions, however: the former describes the recovery’s context, while the latter requires fresh buying support. Holding a breakout, rather than briefly touching a new high, would strengthen the continuation case. A retreat deep into the range would reduce confidence in near-term momentum.
IV. Price-volume structure and price range: local buying improvement has yet to offset weak full-window turnover
The recent cumulative trend in aggressive buying minus aggressive selling is rising, indicating improved short-term support consistent with price approaching the range high. Yet net aggressive buying intensity remains below historical norms, and full-window turnover is also weak. Divergence across observation windows is not automatically a measurement error; it suggests that improvement has yet to broaden into wider participation.
The key test is whether price and volume improve together. A sustained move above the upper boundary, turnover gradually returning to normal, and persistent aggressive buying would provide more complete support for the bullish view. If only price briefly rises before buying fades, the breakout should remain unconfirmed. Local volume strength must not be confused with full-window expansion, nor should touching the range high be taken to mean that upside is exhausted.
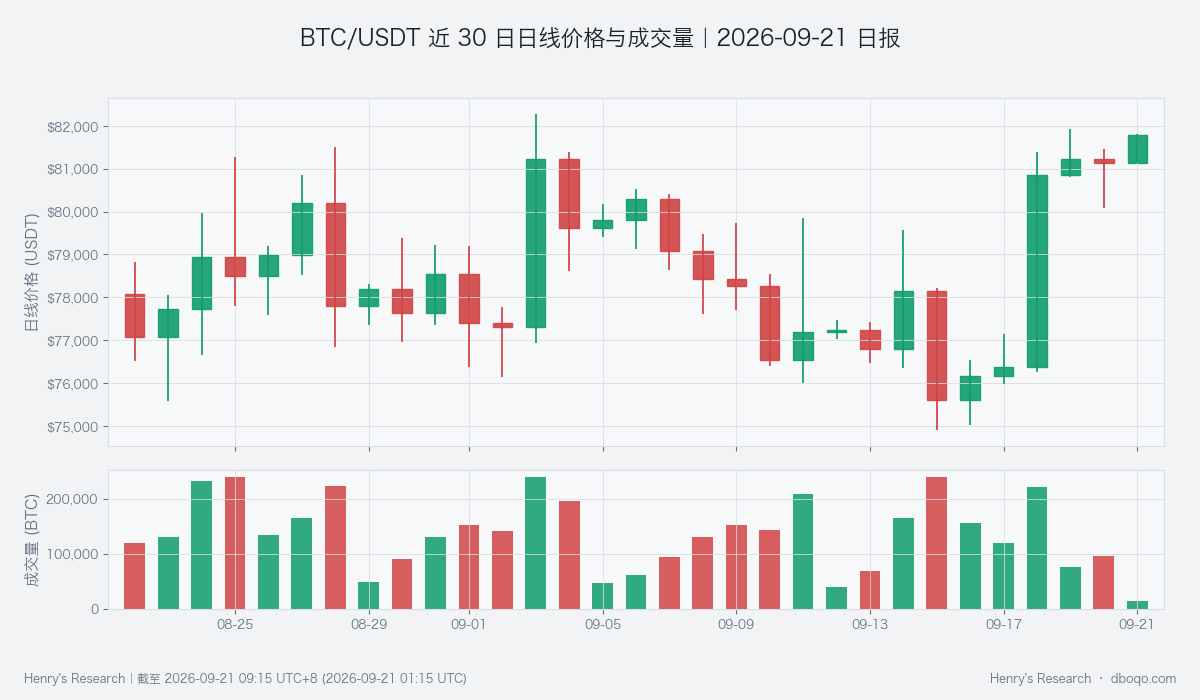
BTC/USDT daily prices and volume over 30 days, showing whether turnover supports the price recovery.
V. Derivatives developments: elevated funding costs cannot replace demand confirmation
Perpetual funding rates represent periodic payment costs between the two sides of a contract. The 24-hour average is +0.008852%, above the historical mean of +0.003264%. Among 180 comparable periods, only approximately 10 were higher, placing it at a rare high. This compares average rates within each window, not an actual payment amount obtained by adding observations, and the average is not the latest quoted rate.
A relatively high positive rate indicates that bullish demand carries a cost, but does not prove that fresh capital can sustain the advance. This measure supplies no independent direction and has not met this period’s statistical-anomaly criteria. If price stalls while funding costs remain high, continuation risk would increase. Steady price gains accompanied by expanding turnover, without an excessive increase in costs, would better support the durability of demand.
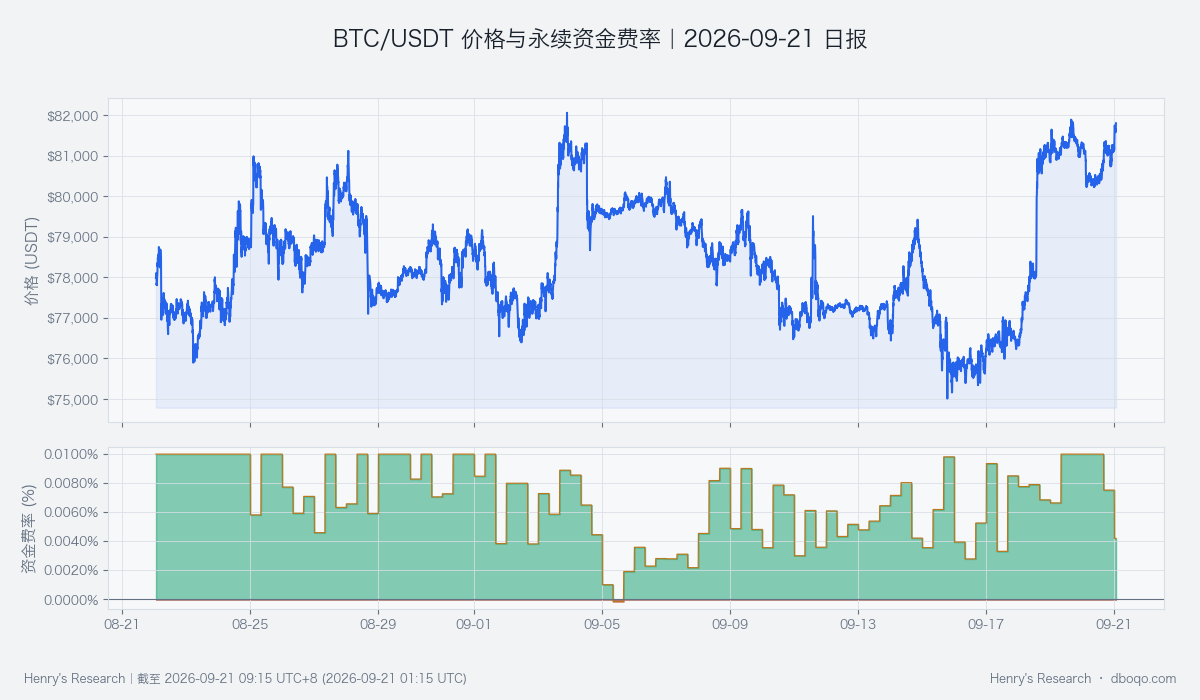
BTC/USDT prices and perpetual funding rates over 30 days, comparing price performance with funding costs.
VI. Cross-market and capital conditions: neutral capital temperature leaves stronger linkage exposed to external sentiment
BTC cross-market capital temperature is neutral. ETF net inflows over 5 days are 11.63, versus historical average net outflows of 0.20, with both amounts expressed in hundreds of millions of US dollars. The current reading is higher than approximately 88% of comparable periods, a relatively elevated level. This provides capital support for the bullish case; watch whether inflows persist. It is not immediate intraday buying, however, and does not establish that ETF flows directly caused the current price gain.
Stablecoin supply is still contracting over the shorter window but expanding over the longer one. Relative dollar pressure is elevated, while the US equity volatility risk reflected in VIX remains within its usual range. These factors offset one another, so ETF inflows alone do not indicate a broad warming of capital conditions. Stronger US equity linkage makes changes in risk sentiment more relevant, but correlation itself is not directional. If dollar pressure rises, volatility risk increases and ETF support weakens, neutral capital conditions may lose their cushioning effect.
VII. Composite signal and scenario checks: bullish price evidence still lacks broad capital confirmation
The composite signal is bullish, consistent with the price recovery and recent improvement in buying. Yet weak full-window turnover and neutral capital temperature do not provide full confirmation. The base case is for price to remain near the upper range and seek continuation, conditional on recovering participation. A breakout supported by sustained buying and improving capital conditions would strengthen the view; the composite signal alone cannot substitute for this evidence.
The opposing scenario is a breakout followed by retreat, persistently weak turnover and deteriorating external risk sentiment. That combination would invalidate the bullish view. An intermediate scenario is for price to hold the range while volume never expands; in that case, a range-bound interpretation should be accepted rather than forcing an accumulation narrative onto sideways trading. Rarely strong linkage warrants attention to sentiment transmission, but cannot determine the next direction in advance.
VIII. Risk warnings
Historical relative standing measures rarity, not the probability of future gains or losses. Rolling correlation observations overlap, so historical windows cannot be treated as independent predictive trials. ETF, stablecoin and macro indicators have different frequencies, and update lags may leave short-term changes incompletely reflected. Unexpected events may also affect markets. The current conclusion applies only to the stated conditions and horizon and should be reassessed when those conditions change.
Disclaimer: This report was prepared by dboqo using market data as of 2026-09-21 09:15 UTC+8. Cryptocurrency markets are highly volatile. This report is an objective analysis of market phenomena only and does not constitute investment advice. Investors must assess risks independently and make prudent decisions.