I. Core findings and direction this week: Dollar strength tests a rebound still lacking broad confirmation
Data scope: This report covers the complete UTC calendar week from 2026-09-14 through 2026-09-20, with data current through 2026-09-20 23:55 UTC. Historical comparisons use 104 complete comparable weeks. Price changes use a consistent intraweek close-to-close methodology, while lower-frequency capital data are interpreted within their original observation windows.
Core finding: BTC prices recovered materially, while the U.S. dollar remained unusually strong relative to its recent levels; volume-price and capital evidence have not jointly confirmed continued trend extension. Among 104 comparable weeks, only about 7 showed a higher dollar-index deviation than the current reading, placing it at an unusually high level. This means external conditions are not loose, but it cannot negate the rebound that has already occurred, nor can their coexistence be presented as a certain causal relationship.
Historical comparison: Under the unified comparison methodology, BTC gained +5.62%, versus a historical mean of +0.45%. It was higher than about 84% of comparable weeks, placing it at a relatively high level. The advance was stronger than usual, but without correspondingly exceptional volume. Next week, the focus should be whether capital catches up, rather than extrapolating one relatively strong rebound directly into a sustained rise.
Methodology review: No candidates for anomalies in units, frequency, or magnitude were identified. The historical price comparison differs slightly from the weekly open-to-close return methodology and the two should not be conflated; ETF rolling flows, stablecoin growth, and daily liquidations are not double-counted. A relatively high statistical position also does not imply a data error.
Directional view: Range-bound. Assessment horizon: The next UTC calendar week. Conditions for this view: The price recovery continues to find support on pullbacks, while aggressive buying and capital conditions do not improve persistently and dollar pressure remains. Invalidation conditions: A valid break above this week's high accompanied by stronger buying and capital conditions, or a break below this week's low accompanied by worsening capital conditions, would invalidate the core range-bound view.
II. Historical comparison and key deviations: Price is stronger than normal, but trading participation has not expanded in tandem
Weekly volume was 1,071,867 BTC, versus a historical mean of 1,243,451 BTC. It remains close to the historical middle range and within normal levels. This combination does not mean that lower volume necessarily leads to a decline; rather, the price gain stands out while participation does not, so the durability of a breakout still requires verification. If prices rise next week alongside expanding volume, the rebound would gain additional support; if only prices rise, the original questions remain.
The U.S. dollar is this week's most noteworthy external deviation, but it has not been identified as a statistical anomaly or methodology error. It forms the central tension with the price rebound: BTC has shown an ability to resist external pressure, but whether that resistance persists depends on actual buying rather than the dollar indicator alone. Historical relative positioning provides contextual comparison, not the probability of a market replay, and does not independently prove direction.
III. Price action and trend: Recovery was clear in the second half of the week; weekend follow-through remains to be verified
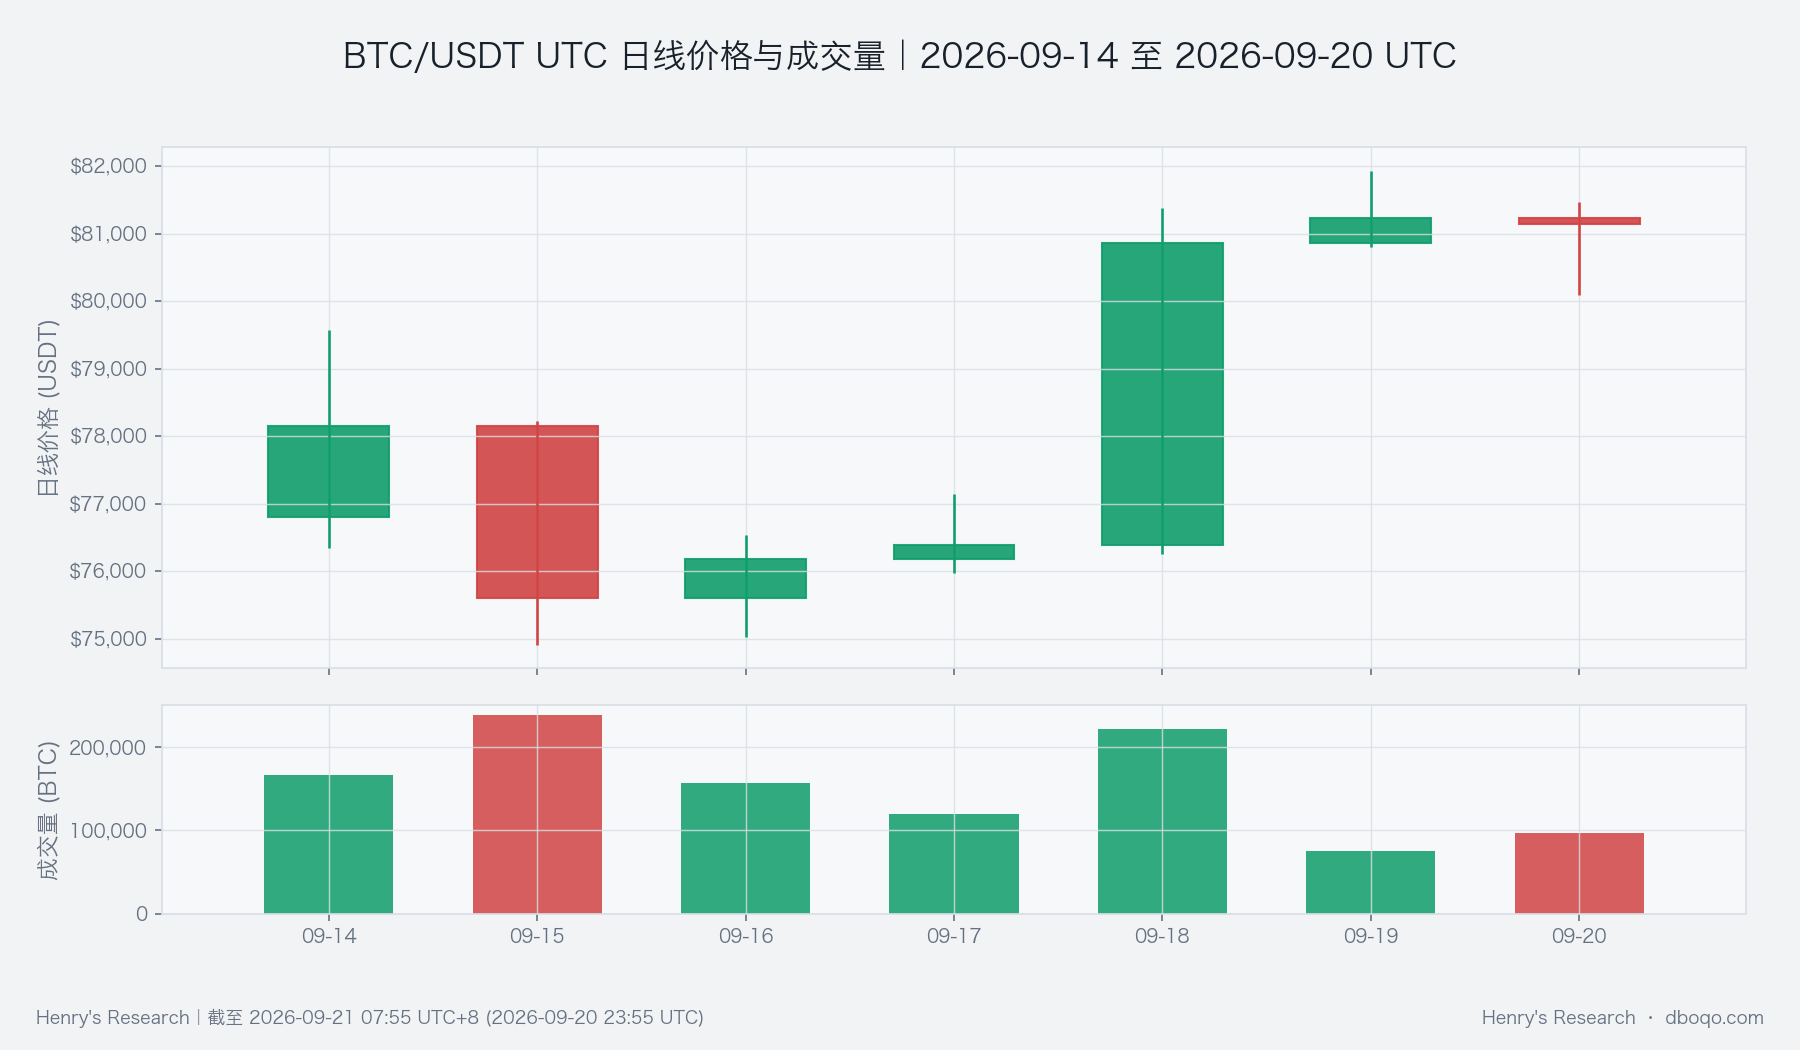
Prices first declined and then recovered, with most of the advance concentrated in the second half of the week, followed by consolidation at higher levels over the weekend. The weekly close of 81,143.90 USDT shows that most of the recovery was retained; it is better used as a reference for judging pullback support next week than as support guaranteed to hold. If prices remain in the post-recovery area, the range-bound view gains support; if they quickly return to the pre-rebound area, the recovery becomes less credible.
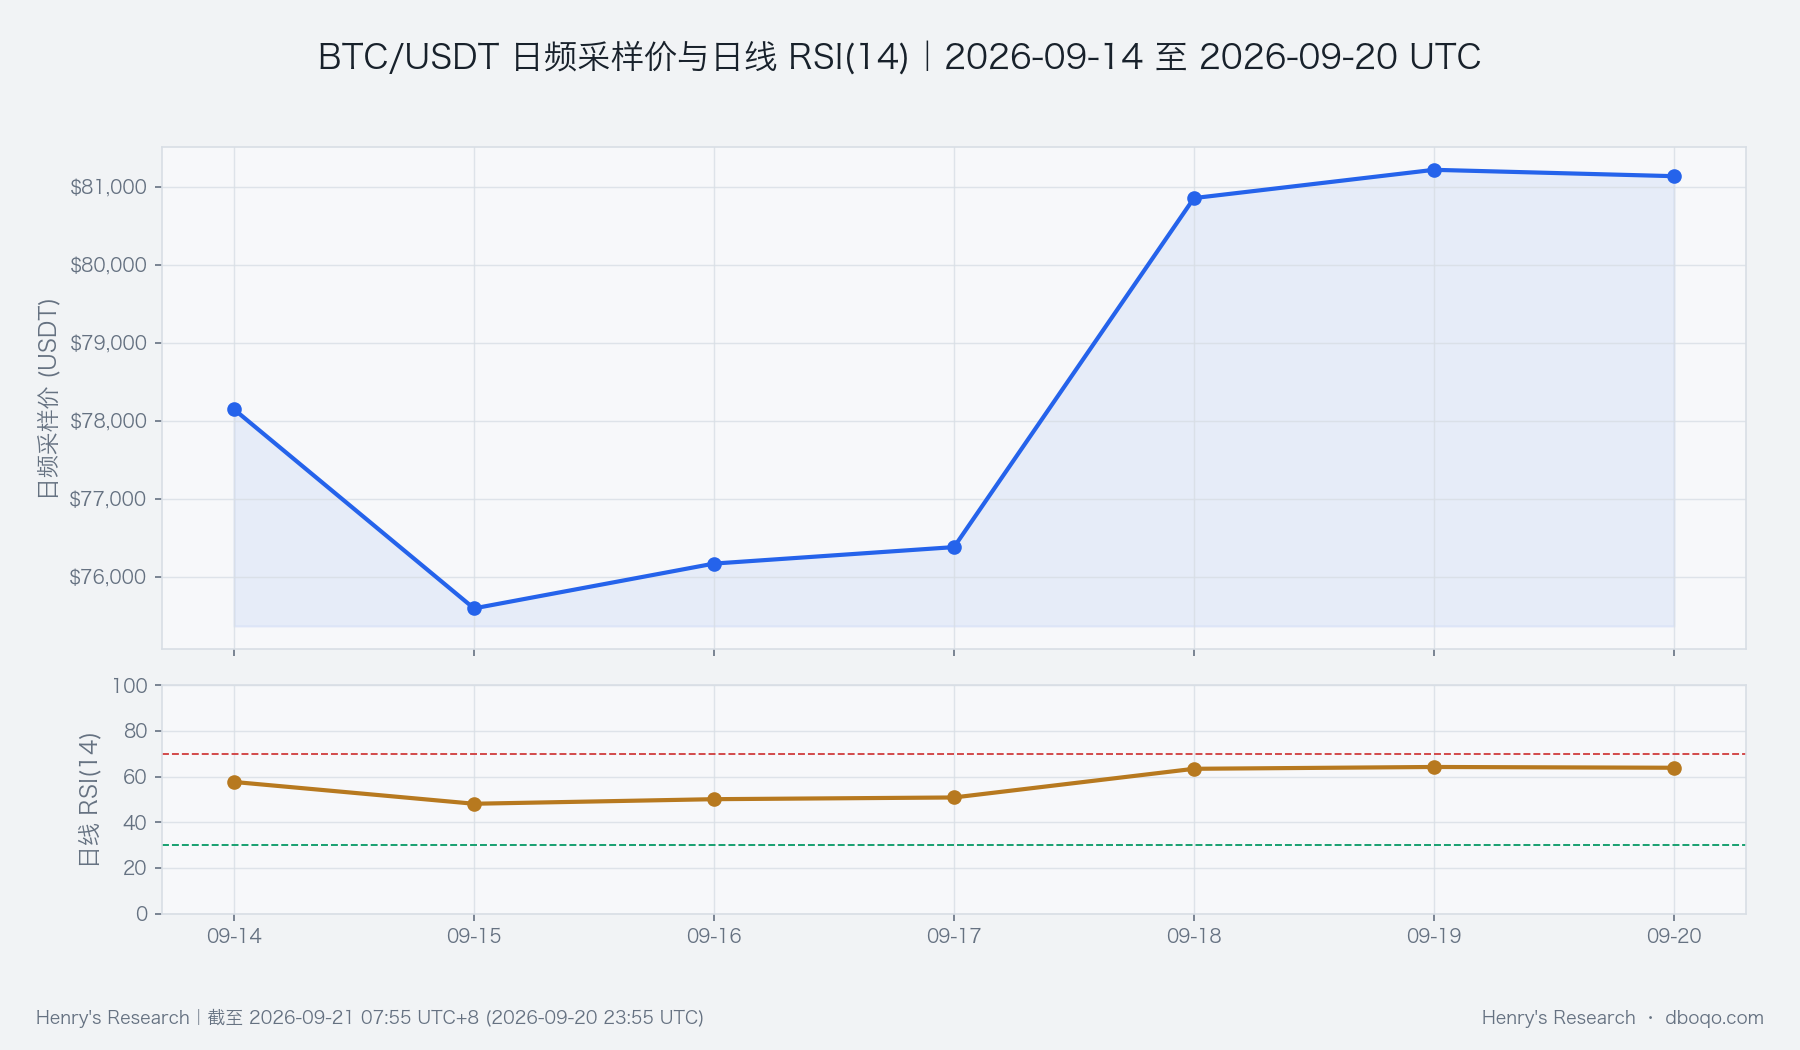
Price and volume in the chart should be read together: rising days did have volume support, but weekend volume fell materially, so a weekly close near the highs alone cannot establish that demand is continuing to strengthen. RSI measures the relative strength of upward and downward momentum. Daily RSI rose with prices, indicating that the recovery has a momentum basis; it does not prove that prices will rise next week at the same pace. Next week, the focus is whether momentum remains stable on pullbacks and whether volume follows on renewed advances.
IV. Volume-price structure and price range: Aggressive buying has not yet offset weekly selling pressure
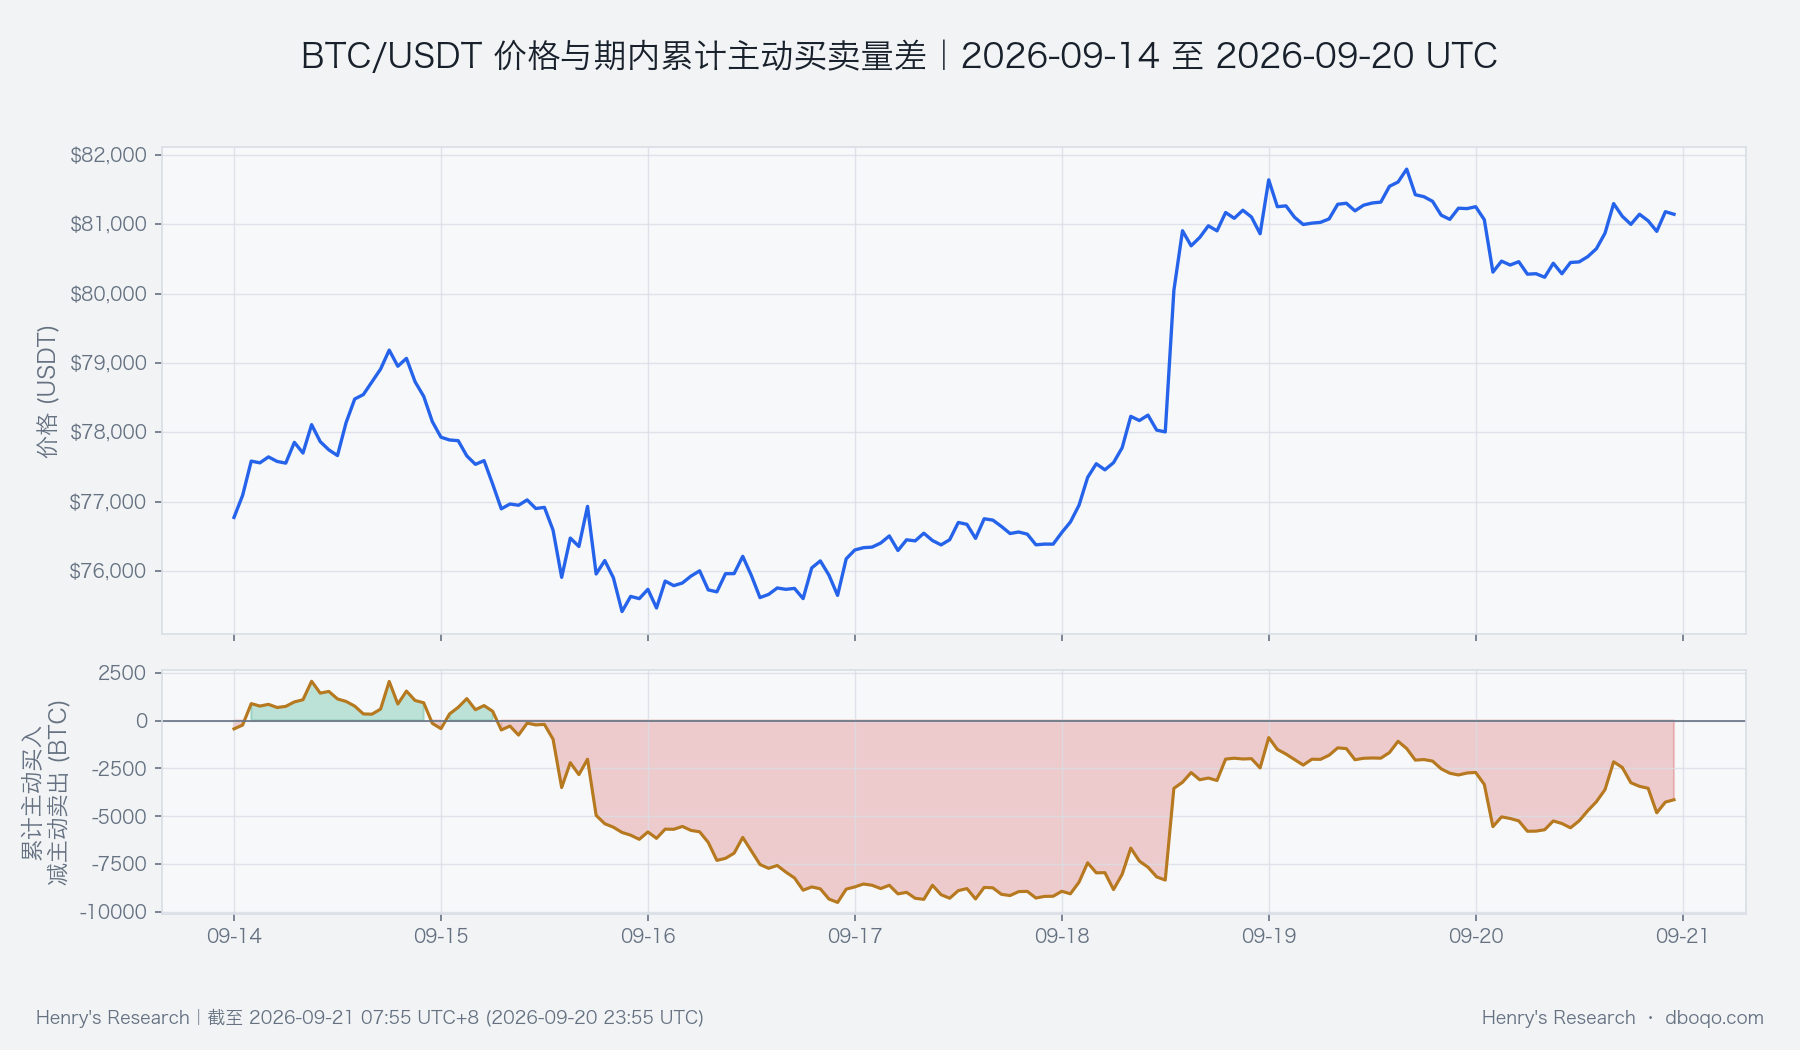
Aggressive buys minus aggressive sells is used to observe which side of trading is more actively pushing prices. The cumulative difference fell clearly in the middle of the week, recovered with the second-half rebound, but still had not returned above its starting point by the weekend. This indicates that the price increase was not fully aligned with net aggressive buying over the full week, and explains why this report views the market as a supported recovery rather than giving an unconditional bullish conclusion. This indicator does not cover all funding channels and cannot identify trader identities or infer specific trading motives.
This week's high of 81,933.90 USDT is the level to watch for continued upside, while the low of 74,909.40 USDT is the lower boundary of this week's recovery structure. Both describe the price range that has already occurred, not pre-set return targets. If prices move above the upper boundary next week and aggressive buying continues to strengthen, the volume-price divergence would ease; if prices break below the lower boundary and aggressive selling pressure intensifies, the range-bound framework should be withdrawn. A momentary touch of a boundary is insufficient; subsequent holding and volume participation matter more.
V. Derivatives deviations: The cost of bullish exposure is elevated, but broad overheating is not yet confirmed
Funding rates reflect the carrying cost between long and short positions in perpetual contracts. The mean observed value this week was +0.007087%, versus a historical mean of +0.004796%. It was higher than about 80% of comparable weeks, placing it at a relatively high level. This indicates that bullish demand carries a relatively higher cost, but does not by itself imply extreme crowding or an inevitable pullback. If prices stall next week while rates continue rising, the rebound becomes more fragile; if prices and buying strengthen while rates remain moderate, the concern eases.
The comparison here concerns the average level of observed funding rates, not weekly cumulative returns or total carrying cost. Derivatives readings and aggressive buy-sell evidence together indicate that price recovery does not mean all participants are strengthening demand in the same direction. Liquidations are observed daily and are subject to publication lags; repeated high-frequency readings cannot be added together into a larger amount, nor should liquidation data be used to invent a single cause for price movements.
VI. Cross-market and capital conditions: ETF inflows provide support, while overall capital conditions remain neutral
Measured in hundreds of millions of U.S. dollars, ETF net inflows over the past 5 days were 2.79, versus a historical mean of 3.61. This remains within the normal historical range. Net inflows argue against excessive pessimism, but the scale is insufficient to prove a broad acceleration of capital entering the market. Next week, watch whether net inflows persist and expand, and whether they occur alongside improved prices and aggressive buying; inflows through a single channel cannot substitute for confirmation of overall demand.
Stablecoin supply growth over 7 days was -0.08%, versus a historical mean of +0.50%. It was lower than about 72% of comparable weeks and slightly below normal. This shows that capital supply available to the crypto market has not expanded materially recently, but it does not mean an equivalent amount of capital has already sold BTC. ETFs and stablecoins each have their own rolling windows and update lags; unchanged weekend readings do not imply an absence of weekend trading, and these figures must not be repeatedly added across time points.
BTC cross-market capital conditions are neutral (-0.20), meaning that support and pressure from ETFs, stablecoins, the U.S. dollar, and market risk appetite broadly offset each other. Dollar strength imposes constraints, while ETF inflows and relatively moderate risk sentiment provide a buffer; therefore, capital flows have not strengthened to the same extent as prices. If capital conditions continue to improve and buying recovers next week, the range-bound view would face an upward revision; if capital conditions weaken as buying support fades, it would face a downward revision. This composite reading is conditional, not a capital-inflow amount, and does not guarantee that prices follow the change.
VII. Composite signals and next-week scenarios: Near-term weakness coexists with price recovery; the baseline remains range-bound
The composite signal is bearish, consistent with evidence that aggressive buying has not fully recovered, yet not fully consistent with this week's price gain and ETF net inflows. The broader assessment therefore remains range-bound: it recognizes that the rebound has occurred while retaining the risk of insufficient follow-through in demand. For such divergence, the most useful approach is to state the observable conditions that could overturn the view, rather than selecting a preferred single indicator and ignoring contrary evidence.
The base scenario is that prices digest gains within this week's range, with neutral capital conditions and fluctuating buying. The upside scenario requires prices to break out and hold, while trading participation, aggressive buying, and capital evidence improve; the downside scenario is a loss of the lower boundary, with selling pressure and weakening capital conditions confirming each other. If only one indicator changes, first reduce confidence in the assessment; if multiple independent pieces of evidence move in the same direction consecutively, reassess direction. A brief price move beyond a boundary or a one-day capital fluctuation is insufficient to prove that a scenario has been established.
VIII. Risk notice
Historical comparisons describe relative positioning under similar statistical methodologies and are not promises of future performance. Cross-market relationships may change, capital indicators may lag or be revised, and derivatives markets and other funding channels may diverge. This report only explains the phenomena jointly presented by price, trading, and capital indicators; it does not treat simultaneous changes as driven by news events or specific groups. Next week, continue to verify the conditions for validity and invalidation, and avoid treating the range-bound view as permanently valid.
Disclaimer: This report is prepared by dboqo based on market data available through 2026-09-21 07:55 UTC+8. Cryptocurrency markets are highly volatile. This report is only an objective analysis of market conditions and does not constitute any investment advice, and investors must assess risks independently and make prudent decisions.