BTC has shifted from the higher-volume recovery in the previous report to barely moving at all, while trading volume has fallen to a rare low. It gained just 0.02% over the past 24 hours. We expect a range over the next 24 hours: there is too little trading to confirm that the rebound can continue, but price has not resumed a sharp slide either. The key question is whether renewed activity can lift BTC back above its short-term average.
Trading has thinned sharply, so a flat price does not confirm the rebound
At 08:45 Beijing time, BTC stood at 81,471.80 USDT after trading between 80,751.00 and 81,733.00 USDT over the past 24 hours. The last completed report described heavier trading and a modest recovery; now price has barely moved, while volume has dropped to 44,949 BTC, far below the historical mean of 147,113 BTC. Among 180 comparable periods measured at the same cutoff, only about 8 had volume this low or lower. The shift from active trading to sparse participation means this pause in the decline does not, by itself, show that buyers have taken control.
BTC also remains below its 10-day average of 82,276.37 USDT. That average helps show where price has centered recently; failing to regain it after a rebound leaves the recovery unproven. Thin trading makes a single day's move less telling. If selling returns with higher volume, today's calm may prove temporary. If BTC rises on stronger trading and holds above the average, that would carry more weight than the current small gain.
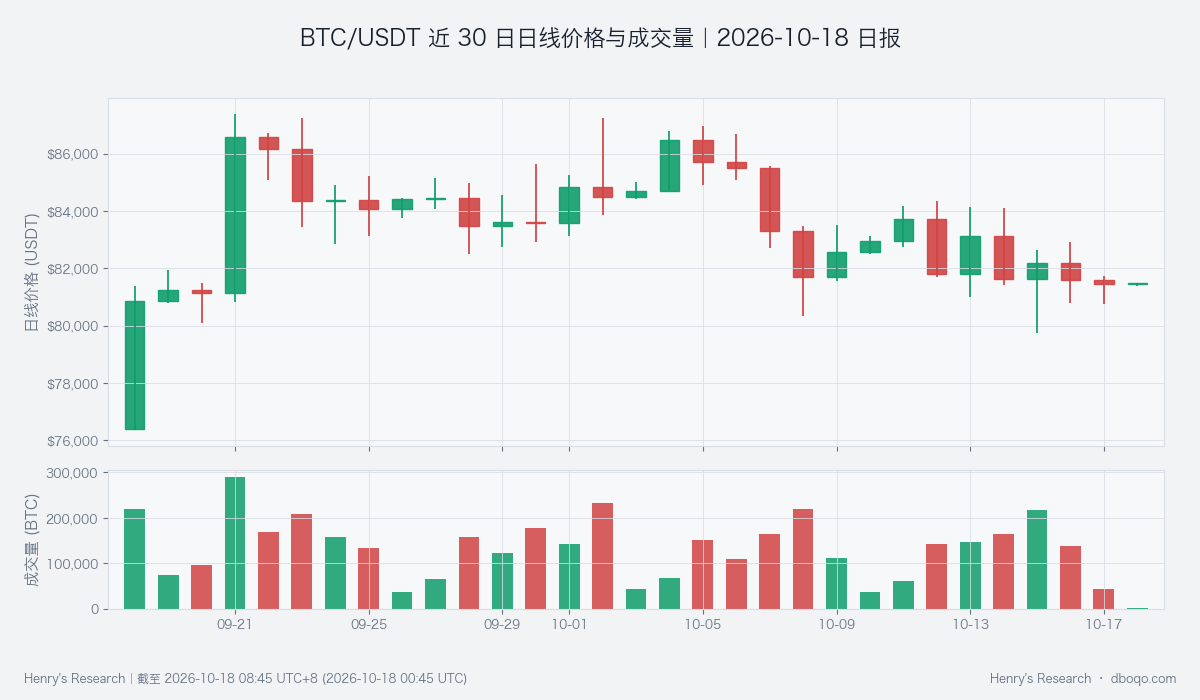
Price is flat while trading has fallen sharply.
Near-term buying has improved, but outside risks still weigh on gains
The short-term balance of active buying minus active selling is about positive 36 BTC, above its historical mean of about positive 1 BTC. This is a constructive counterpoint to the quiet market: some buyers are still present. Yet trading is too thin to show that their demand can keep pushing price higher. The broader signal also points to a range, consistent with the market's mixed forces.
US equity volatility expectations are another constraint. VIX tracks investors' concern about future US stock-market swings, and its reading relative to its own history is unusually high: only about 2 of 180 comparable periods were higher. BTC's link with US stocks is elevated too, so changes in outside risk matter, though correlation does not guarantee the same price move. ETF flows show a net outflow of 2.45 hundred million US dollars over 5 days, offering no clear support for gains. That multi-day measure cannot directly explain today's flat price.
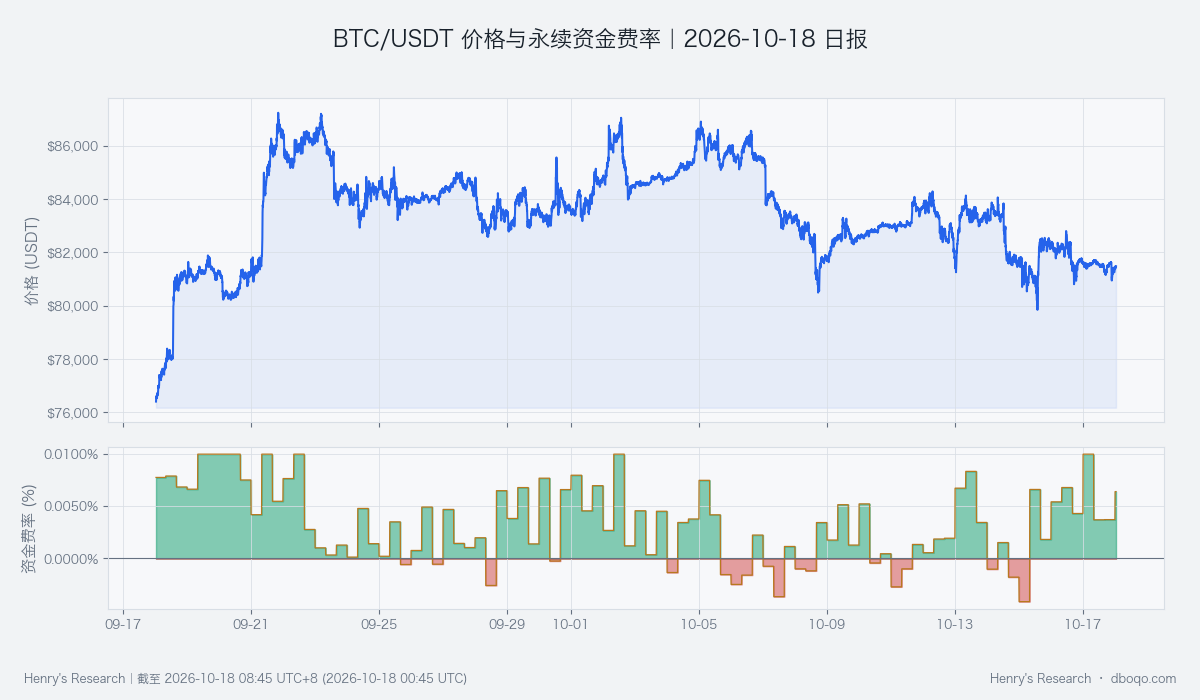
Watch the derivatives funding backdrop as price steadies.
A higher-volume move above the average would change the range view
Over the next 24 hours, first watch for a break above this period's high near 81,733.00 USDT. Then see whether BTC can hold above its 10-day average of 82,276.37 USDT as volume recovers and active buyers retain the lead. If those changes arrive together, the range view needs to be reassessed. Conversely, a drop below this period's low of 80,751.00 USDT on rising volume would make today's pause look more like a break within weakness. Until either case develops, a tiny gain is not a new trend.
Data context: As of 2026-10-18 08:45 UTC+8, price and volume cover the past 24 hours. Historical comparisons use 180 periods at the same cutoff; ETF flows retain their own 5-day window.
Disclaimer: This report was prepared by dboqo using market data as of 2026-10-18 08:45 UTC+8. Cryptocurrency markets are highly volatile. This report is an objective analysis of market conditions and is not investment advice. Investors should assess risks independently and make prudent decisions.