A midweek recovery did not erase the weekly loss
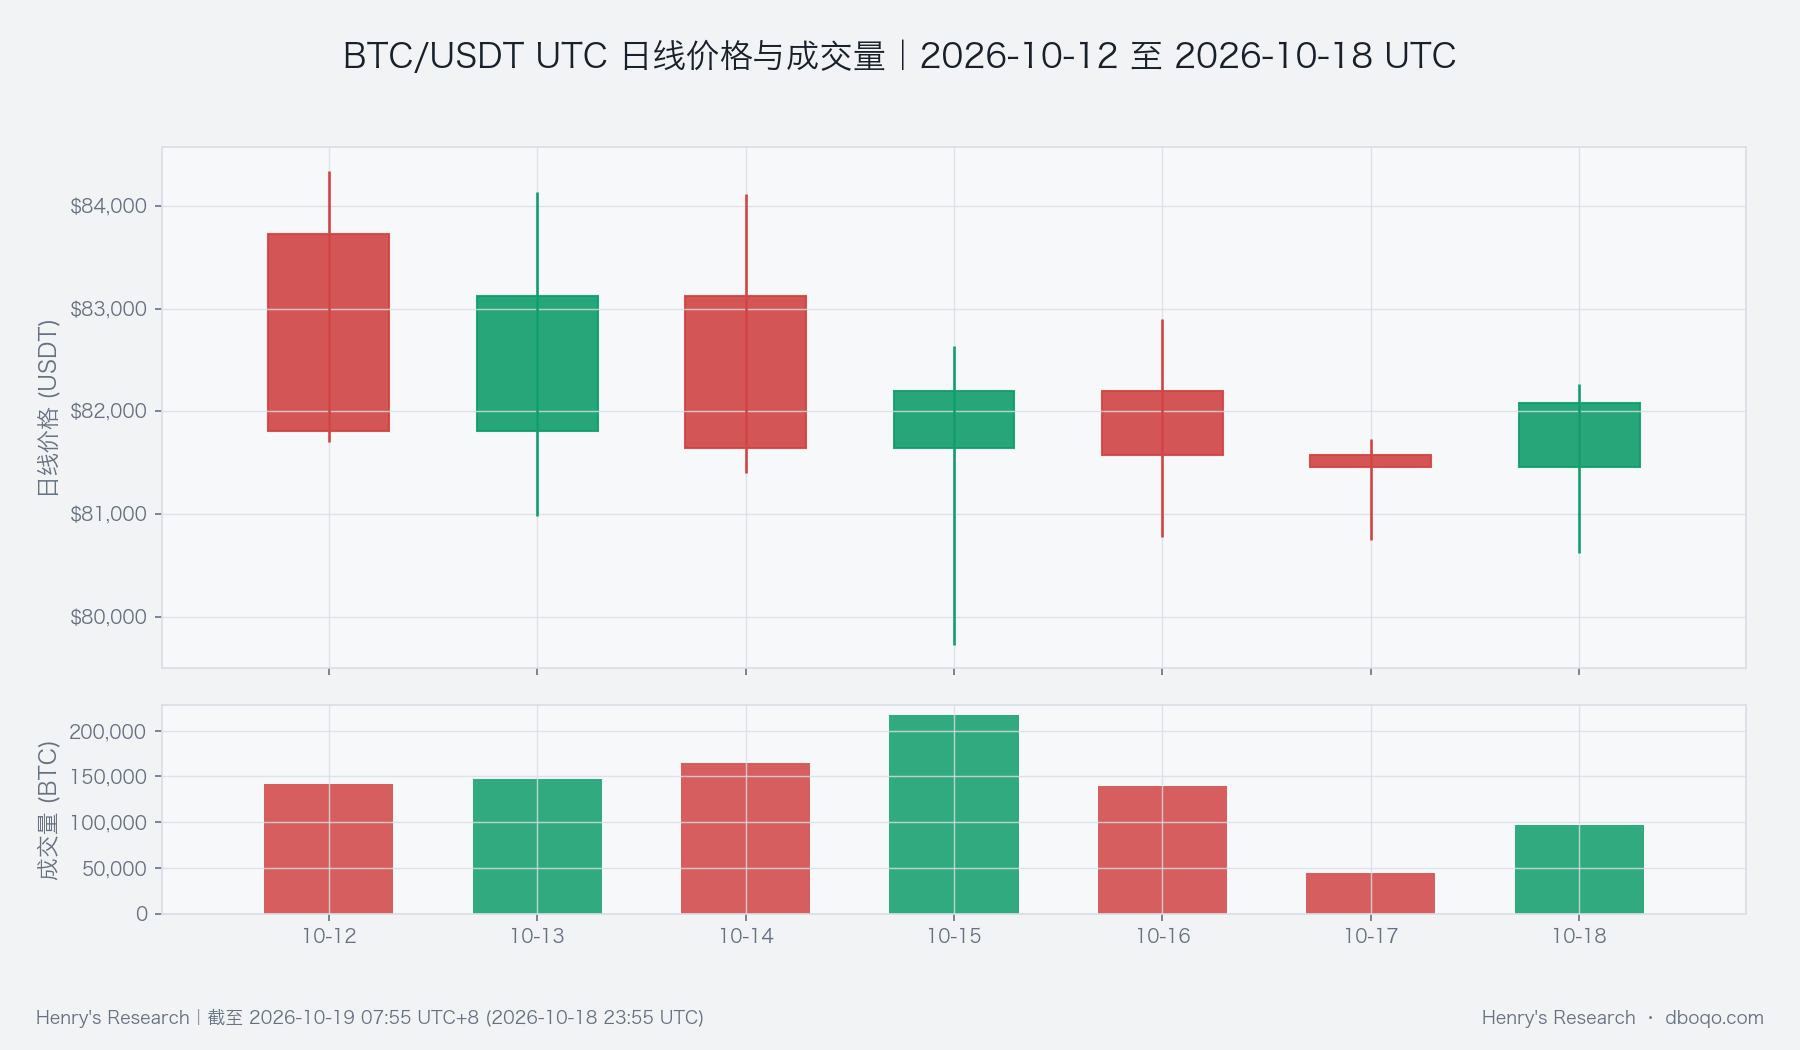
BTC opened the week at 83,723.10 USDT, touched 79,732.30 USDT on Thursday, and closed the weekend at 82,078.00 USDT, down 1.96% from the open. The recovery from the low matters, but it does not turn the full week's decline into a gain. At the same time, VIX, a gauge of expected US equity volatility, stood at an unusually elevated relative level, while funding measures did not improve alongside the rebound. Short-term momentum and the broader risk backdrop therefore point in different directions. Our view for next week is range-bound: sustained volume and buying would strengthen the recovery case; a price bounce with thin participation would leave room for repeated swings within the range.
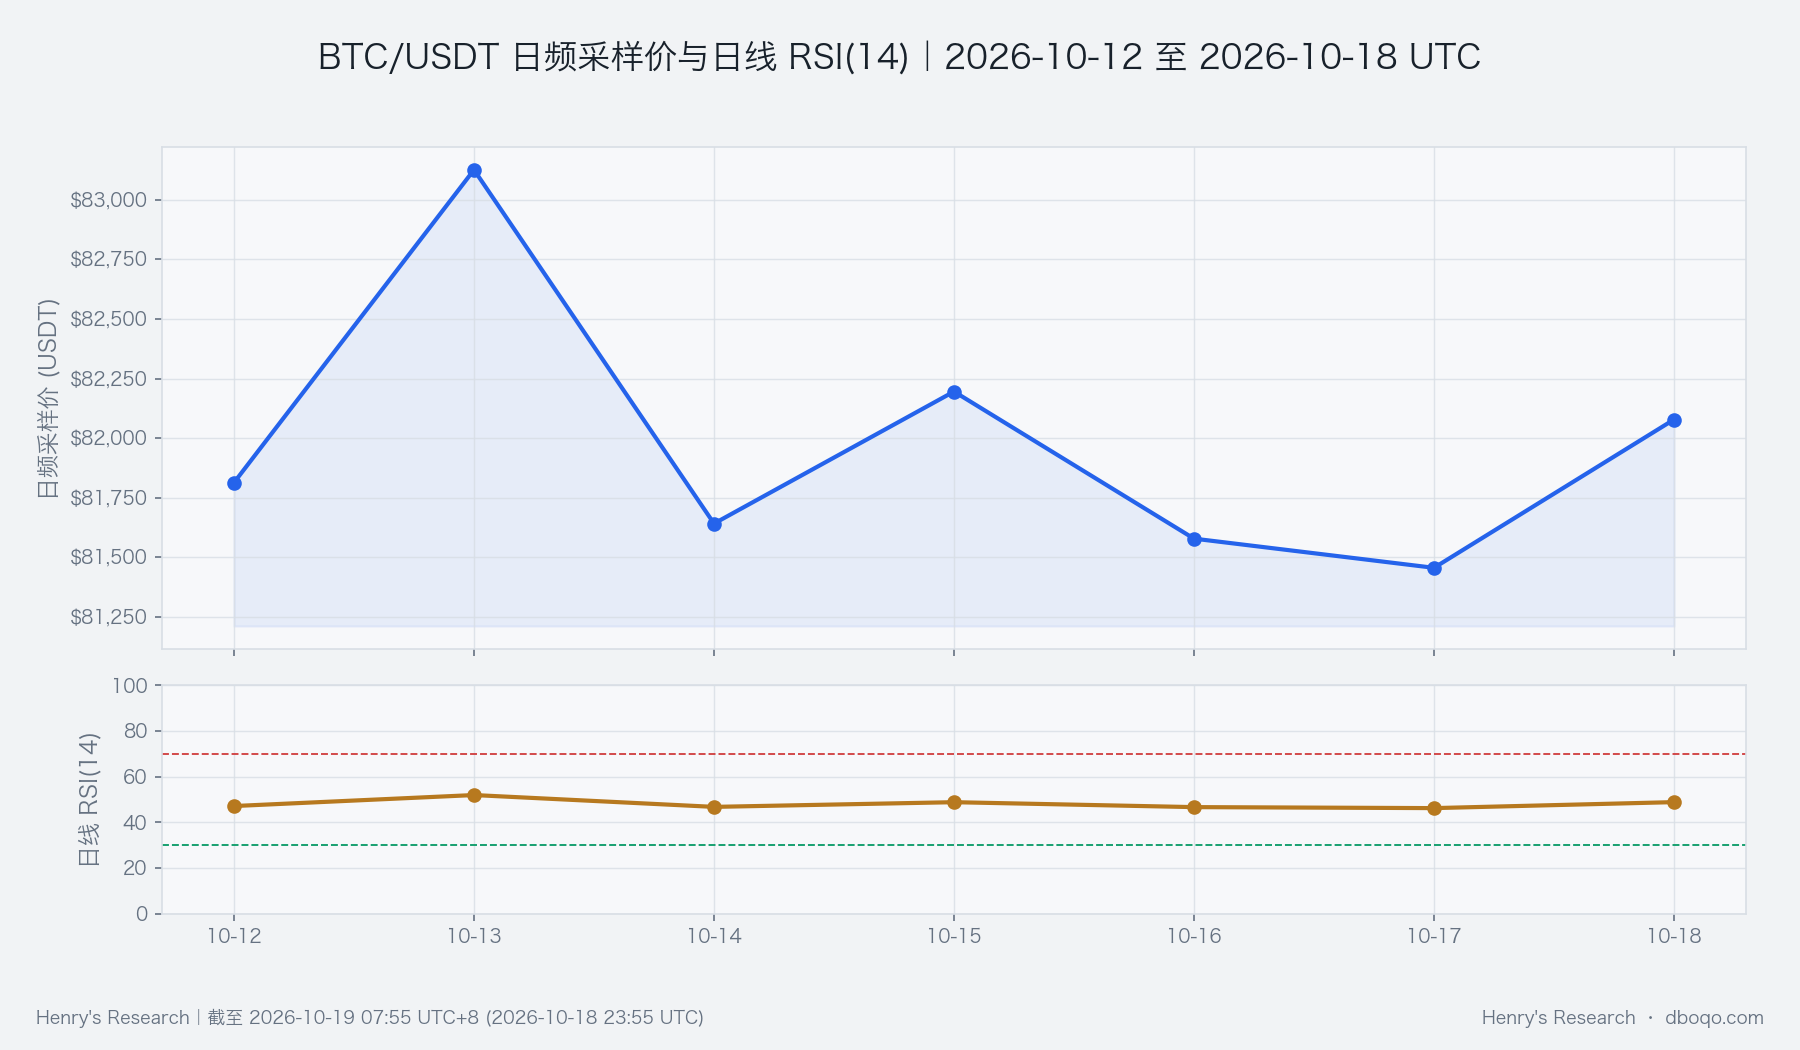
The daily path shows where that tension arose. BTC closed Monday at 81,813.40 USDT and rebounded to 83,125.70 USDT on Tuesday before slipping again. After touching the weekly low on Thursday, it recovered to 82,195.40 USDT that day, yet the weekend close remained below the opening price. Thursday's volume reached 217,327 BTC, the busiest day of the week, versus only 44,806 BTC on Saturday and 96,831 BTC on Sunday. Trading was much more active around the low than during parts of the recovery. That does not prove sellers will stay in control, but the rebound needs more consistent participation to gain credibility.
Short-term momentum improved, while funding and external risk held back conviction
RSI measures the strength of recent price moves. It reached 72.93 at the end of the period; only about 3 of 104 comparable weeks had a higher reading. That stronger short-term momentum gives the weekend rebound some substance, and the short moving-average spread also turned positive. It is the strongest counterpoint to a call for further declines, though a short-term indicator cannot by itself establish the direction of the whole week. Price on the chart remained below the weekly open even as momentum rose. A local bounce and a weekly loss can coexist.
The constraints are equally relevant. VIX stood at 19.99, a relative level exceeded in only about 3 of 104 comparable weeks. It is a lagged view of equity-market risk sentiment, not an established cause of BTC's weekly decline. Five-day ETF flows showed a net outflow of 2.45 hundred million US dollars, against a historical mean net inflow of 3.57 hundred million. Seven-day stablecoin supply growth was -0.33%, below its historical mean of +0.50%. ETF flows span five days and stablecoin supply spans seven; the two cannot be added together or treated as a direct forecast of next week's trades. Alongside VIX, they show why the broader funding backdrop does not yet support a bullish reading of the weekend rebound.
Below-average volume leaves the rebound on trial
Weekly volume totaled 951,633 BTC, versus a historical mean of about 1,220,293 BTC; roughly 66 of 104 complete comparable weeks traded more. The 1.96% weekly decline was not especially rare, ranking below about 65% of comparable weeks. What matters more for next week is that the recovery after the drop did not bring a sustained rise in trading. Combining Thursday's concentrated activity with the quieter weekend would overstate the breadth of the rebound. The volume chart does not say the recovery is invalid; it shows that buyers still need to prove they can remain active on another push higher.
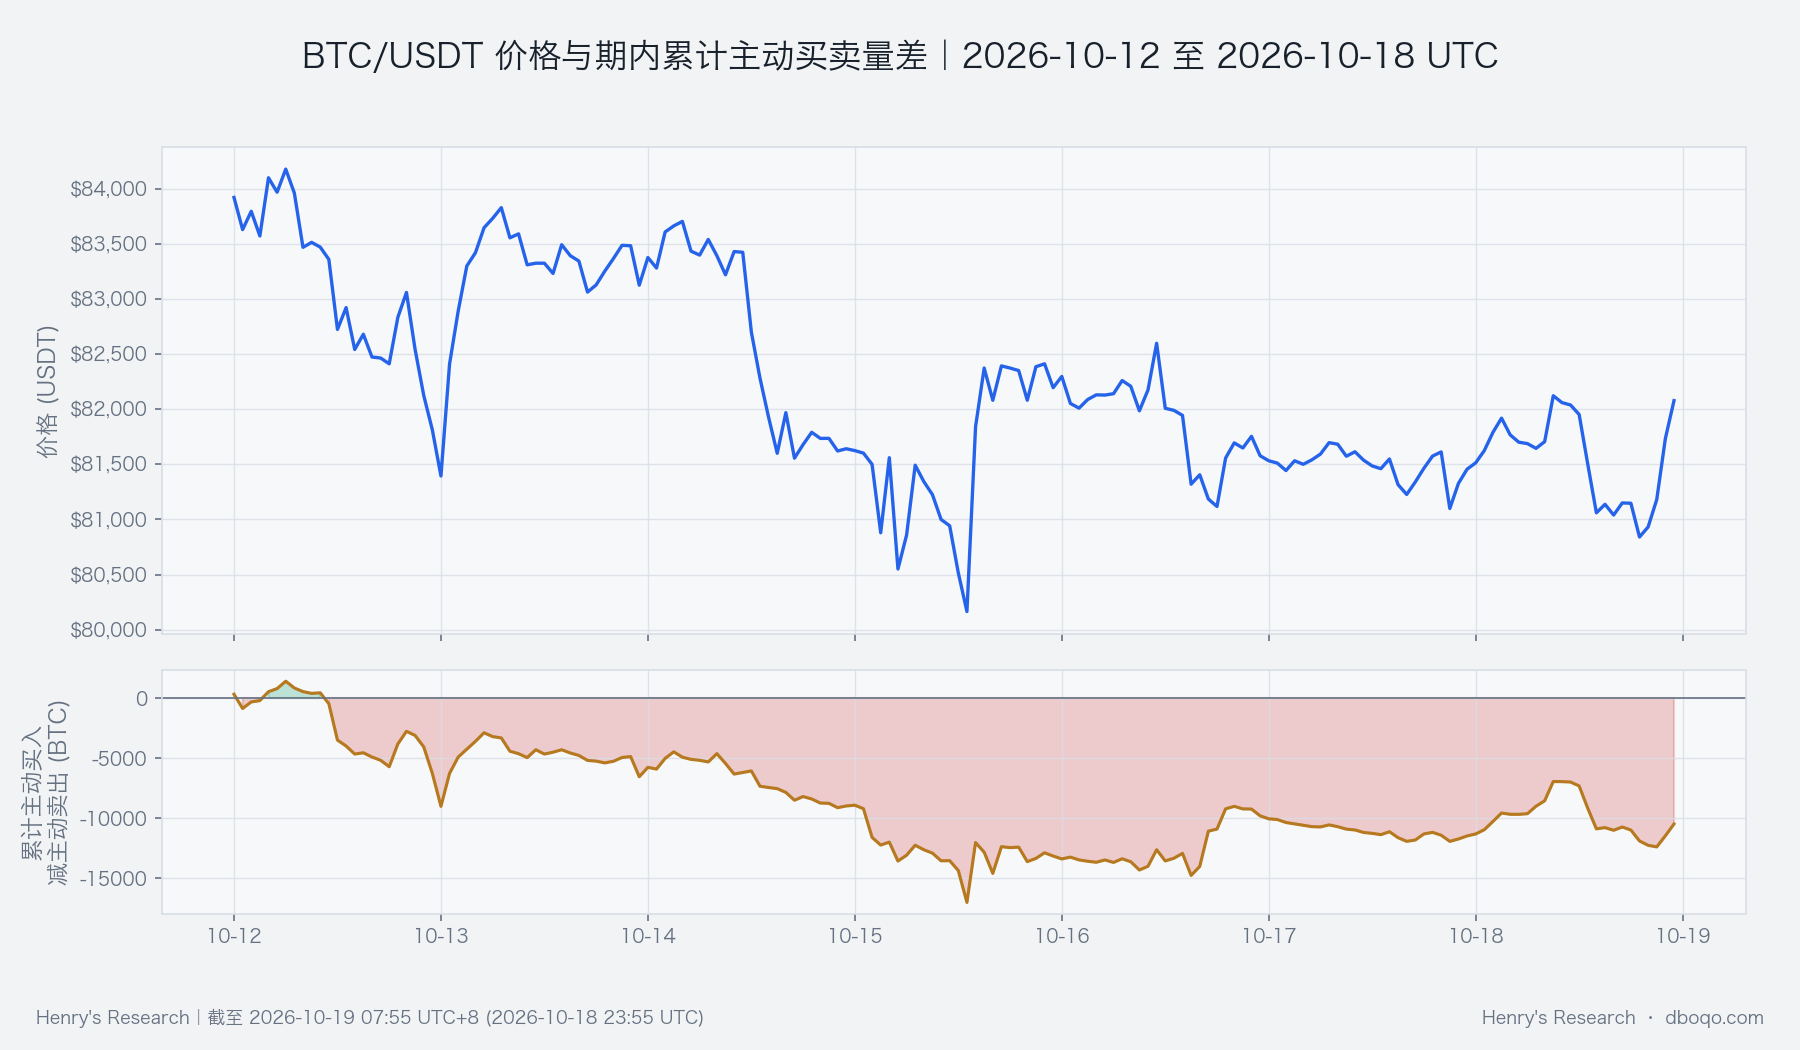
The cumulative balance of aggressive buying minus aggressive selling turned positive toward the close. Its latest slope was about 42 BTC, above roughly 85% of comparable weeks, supporting the case that buyers did step in near the lows. Yet this measure describes trades already made; it does not promise a continuing flow of new money. It sits alongside below-average weekly volume: local buying improved, but broader participation is still unproven. If buying persists on the next advance and daily volume rises clearly above weekend levels, the range-bound view would need reassessment.
Two changes would decide next week's view
First, watch whether volume and aggressive buying both expand as price approaches the opening area. If RSI stays high while trading remains thin, the rebound still lacks broad confirmation. Second, watch whether five-day ETF flows and seven-day stablecoin supply readings improve as external volatility risk eases. A move back above the opening area, backed by both volume and funding, would invalidate the range-bound view and warrant a fresh assessment of upside. A return toward the 79,732.30 USDT low with stronger selling would instead raise downside risk. These are observable conditions, not price targets.
Data context:This report covers the complete UTC week from 10/12/2026 00:00 to 10/19 00:00. Data run through 10/19 07:55 (UTC+8). Historical comparisons use 104 complete comparable weeks; funding measures retain their own observation windows.
Disclaimer:This report was prepared by dboqo using market data through 2026-10-19 07:55 UTC+8. Cryptocurrency markets are highly volatile. This report is an objective analysis of market conditions and does not constitute investment advice. Investors should assess risks independently and exercise caution.