One. Core findings and outlook:BTC rises as contract participation weakens; a bullish bias needs buying confirmation
Core finding: BTC rose this week and its co-movement with US equities strengthened. The main issue, however, is the contrast between unusually weak changes in open interest and an early advantage in aggressive buying that did not last. The price recovery has support from the trend and ETF flows, but the evidence is not uniformly supportive. Next week, the key question is whether an early-week surge can develop into an advance supported by sustained trading demand.
Historical comparison: The average open-interest change rate during the week was -1.79%, against a historical mean of +0.08%. Of 104 comparable weeks, only about 3 had readings this low or lower, making this an unusually weak observation. The price advance was therefore not accompanied by a stronger reading in this measure; rising prices alone cannot establish that derivatives participation expanded alongside them. Next week, watch for a return toward more normal readings and check whether aggressive buying also improves.
Data conventions: The report covers the complete UTC calendar week from 2026-09-21 00:00 to 2026-09-28 00:00, with a cutoff of 2026-09-27 23:55 UTC. The historical benchmark consists of 104 complete comparable weeks. The weekly price return is measured from open to close. The open-interest measure is the average of the change rates observed during the period, not the cumulative decline in total open interest between the beginning and end of the week.
Measurement review: No potential unit, frequency or scale anomalies were identified. The open-interest reading is a statistical market anomaly and should not be mistaken for a data error. Lower-frequency flow observations are used at their applicable timestamps and are not repeatedly added across intraday intervals. Directional assessment: Bullish, although buying activity and cross-market funding conditions have not fully confirmed the move. Assessment horizon: The next UTC calendar week, from 2026-09-28 to 2026-10-05. Conditions for the view: Price holds trend support, rebounds are accompanied by improving aggressive buying, and ETF inflows continue to support demand. Invalidation conditions: Price remains below trend support while aggressive selling increases and the capital temperature weakens. That combination would invalidate the current bullish assessment.
Two. Historical comparisons and key deviations:Weak open-interest changes temper the assessment of the rally
The historical rank of the open-interest change measure matters more than its sign alone. It is now among the unusually low weekly readings, suggesting that participation in this rebound is uneven. A low change rate cannot identify which types of traders exited, however, and it does not prove that short covering drove the rally. Keeping this constraint on market participation separate from the price trend avoids turning a measure without a stand-alone directional implication into an automatic bearish signal.
BTC's co-movement with US equities is another important departure from the historical norm. The correlation over the preceding month stood at 0.4411 at the cutoff, compared with a historical mean of 0.1575. Of 104 comparable weeks, only about 2 had higher readings. This unusually high relationship indicates that BTC has recently been more inclined to move in the same direction as US stocks, weakening the case for treating the advance as an independent trend. If external risk appetite deteriorates next week, BTC's relative resilience will matter. Correlation neither predicts the direction of US equities nor proves that any particular news event caused this week's price action.
Three. Price action and trend:An early surge preserves the weekly gain, but later sessions fail to set new highs
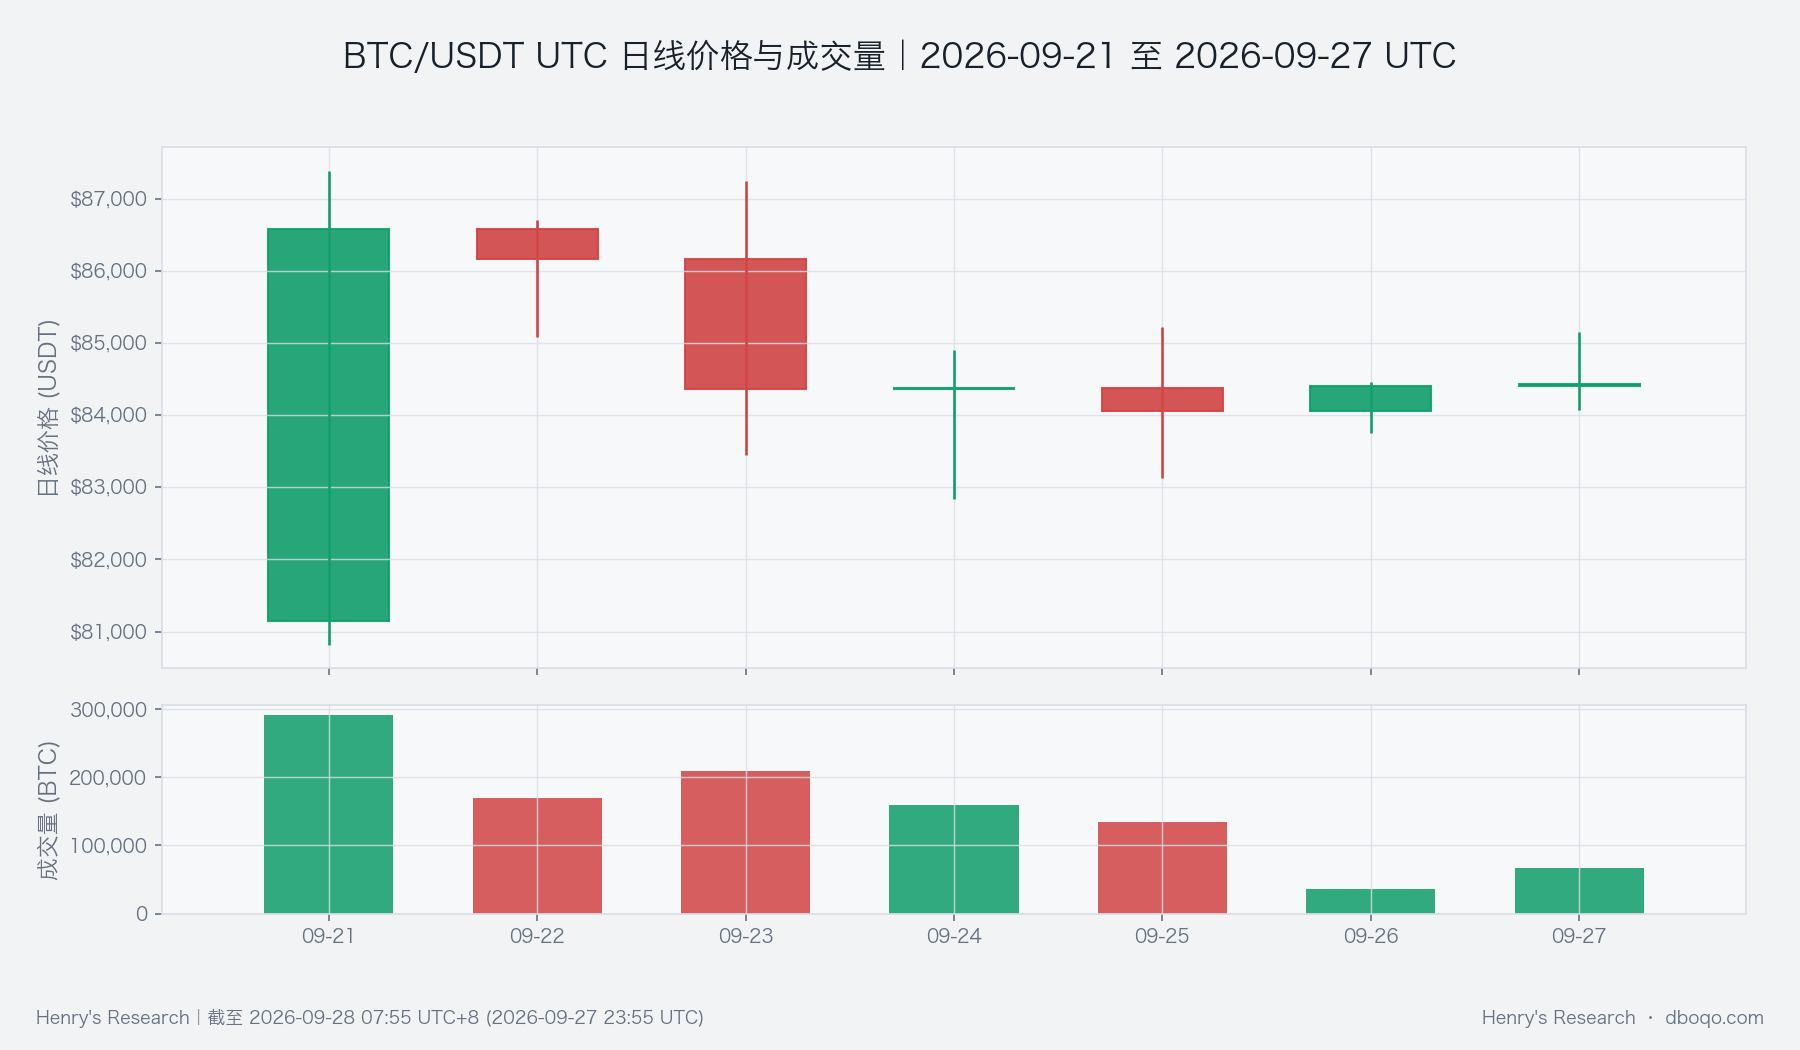
BTC opened the week at 81,144.00 USDT and closed at 84,432.90 USDT, gaining 4.05%. The daily chart shows that the advance was concentrated early in the week, followed by a retreat from the highs and stabilization over the weekend. A positive weekly return shows that part of the recovery remains intact, but the absence of a sustained advance leaves demand to be tested next week. The weekly high of 87,385.10 USDT is a reference for assessing whether overhead supply has been absorbed; merely reaching it would not constitute a confirmed breakout.
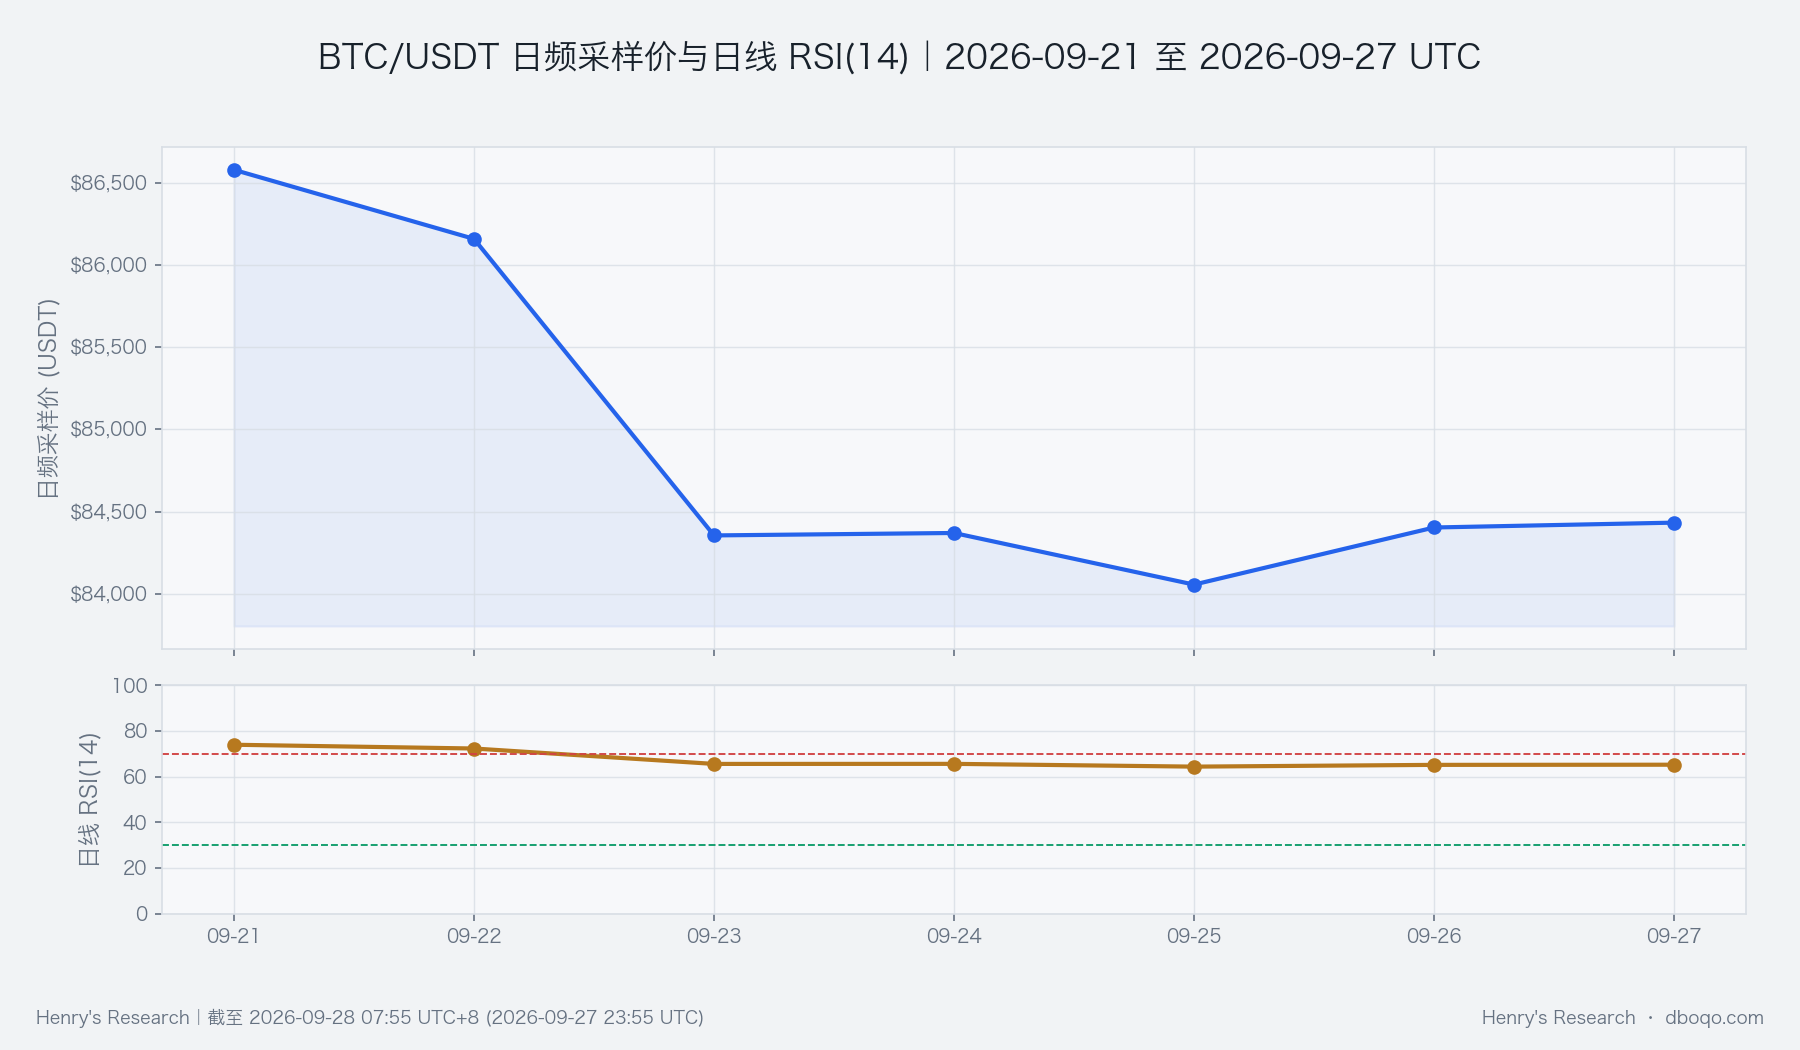
The daily RSI was 64.95. RSI compares the strength of advances and declines over a given period; this reading indicates that the intermediate trend still favors gains, although the retreat from early-week highs signals cooling momentum. These are daily indicators and should not be confused with shorter-term readings at the cutoff. The ten-day average price of 82,954.01 USDT provides a reference for demand: holding around that level after a pullback, followed by renewed buying, would support the bullish view. A sustained break below it would make a positive weekly close insufficient on its own. The average changes as new observations arrive and offers no guarantee of support at a fixed price.
Four. Price-volume structure and price ranges:Volume remains normal, but aggressive buyers lose their advantage
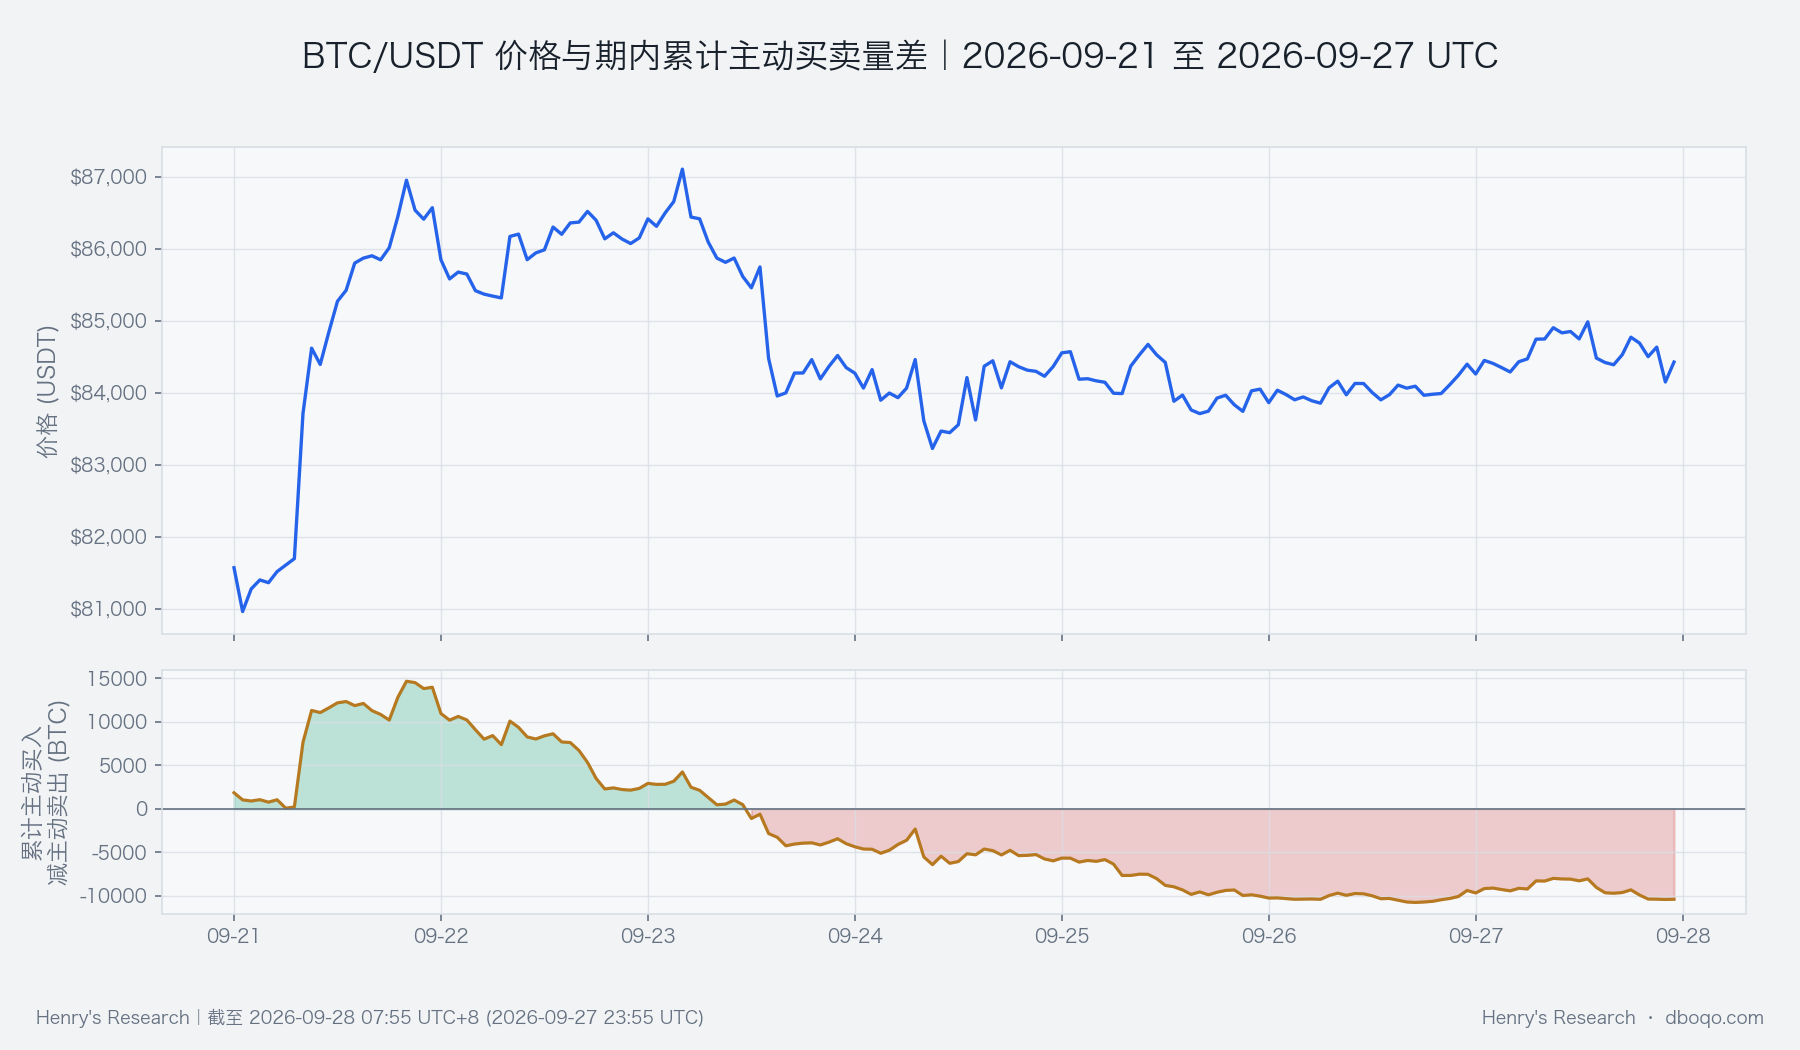
Weekly trading volume was 1,065,216 BTC, compared with a historical mean of 1,237,298 BTC. It remained close to the middle of the historical range and within normal conditions. Volume below the mean should therefore not be described as exceptionally scarce, nor should the price rise be called a volume-confirmed advance. The direction of trading is more informative: aggressive buys minus aggressive sells indicates which side dominates initiated trades. The cumulative curve moved from positive early in the week to negative and stayed below zero through the latter half. This is one of the clearest pieces of evidence against an unqualified bullish interpretation.
The chart shows that price retained part of its advance while the cumulative aggressive-trading balance had already reversed. Price and immediate buying pressure were therefore not strengthening together. This curve only captures aggressive trades within its measurement scope, however, and cannot represent all market capital flows. If price pushes higher next week while the curve keeps falling, the quality of the rebound remains questionable. A sustained recovery in both would provide stronger confirmation. The weekly low of 80,819.40 USDT is a more distant reference for failure of the range, not a forecast destination, and should not be confused with a shorter-term measure of range width.
Five. Derivatives developments:An unusually weak open-interest measure is not a definitive sell signal
Open interest measures the scale of outstanding contracts. A low change rate indicates weaker growth in that participation measure. When it coincides with a positive weekly return, it does not establish that additional contract participation is driving the advance. This week's measure is an average change rate: it must neither be repeatedly summed across timestamps nor restated as an equal decline in total open interest over the week. A recovery next week, measured on the same basis and consistent with volume and price, would be evidence of improving participation.
Funding rates measure the relative carrying cost borne by the two sides of perpetual contracts, while the futures-spot basis measures the contract's price relative to spot. Average funding this week was below its historical mean and the basis remained negative, providing no confirmation of strong demand to chase the rally. These observations are consistent with weak open-interest changes, but do not prove that crowded exposure has disappeared or identify the proportions of voluntary exits and forced liquidations. Next week, the focus should be whether renewed derivatives participation accompanies improving spot activity, rather than an isolated indicator crossing above zero.
Six. Cross-market conditions and capital flows:ETF demand supports the recovery, but the capital temperature remains neutral
ETF net inflows over the latest five-day window exceeded the historical mean and were relatively strong among comparable weeks. This is important evidence against the claim that the rally has no funding support. The five-day flow is a rolling measure, however, not the total of new money arriving during this calendar week, and its daily observations must not be added together. Reporting and market changes may also occur at different times. Next week, watch whether subsequent disclosures sustain the inflows and whether pullbacks attract demand, rather than treating past inflows as a guarantee of future gains.
The BTC cross-market capital temperature was neutral (-0.28). It combines ETF flow intensity, stablecoin supply changes, the dollar and market risk appetite to assess whether different channels jointly support BTC. It is neither a cash-flow amount nor a probability of gains or losses. Strong net ETF inflows over one window do not mean that every funding channel is strong: stablecoin expansion over the longer window remains below its historical norm, while relative dollar strength is a constraint. The lower-frequency and lagged observations make this composite more suitable for confirming the broader environment than for explaining every intraday move. Sustained improvement in the capital temperature alongside recovering buying activity would provide broader support for the bullish view next week.
Seven. Composite signal and next-week scenarios:Maintain a bullish bias, with confirmation more important than the gain alone
The composite signal is bullish. It is broadly consistent with the weekly recovery, daily momentum and ETF inflows, but conflicts with aggressive selling pressure, weak open-interest changes and a neutral capital temperature. The assessment is therefore a conditional directional bias, not a high-conviction forecast of an uninterrupted advance. The open-interest anomaly constrains the assessment of participation quality without determining direction by itself. Stronger co-movement with US equities also requires attention to whether external risk is being transmitted to BTC.
The base case is for price to hold trend support while buying activity gradually improves during consolidation. If a renewed test of the weekly high is accompanied by both a better aggressive-trading balance and improved funding conditions, the bullish case strengthens. The adverse scenario is a rebound that still attracts aggressive selling, weakening ETF demand and a sustained loss of support; that would invalidate the original view. If price merely moves sideways while buying fails to recover, confidence in an extended advance should fall. New counter-evidence must not be ignored just because the report's directional label has not changed. These scenarios are a framework for observation, not predetermined paths or return targets.
Eight. Risks
Historical rankings describe how unusual an observation was within past samples; they do not translate directly into probabilities for next week. Correlations can change, lower-frequency flow data can lag, and the aggressive-trading balance does not cover every venue. Indicators measured over different windows are not interchangeable, and moving averages and range positions change with market conditions. This report does not use external news to establish causation. New funding, liquidity or cross-market shocks require a fresh assessment of the conditions underpinning the view, rather than extrapolation of this week's observations into a long-term conclusion.
Disclaimer: This report was prepared by dboqo using market data available as of 2026-09-28 07:55 UTC+8. Cryptocurrency markets are highly volatile. This report provides an objective analysis of market conditions and does not constitute investment advice. Investors must assess risks independently and exercise prudent judgment.