A late-week rebound repaired the decline, but volume lagged
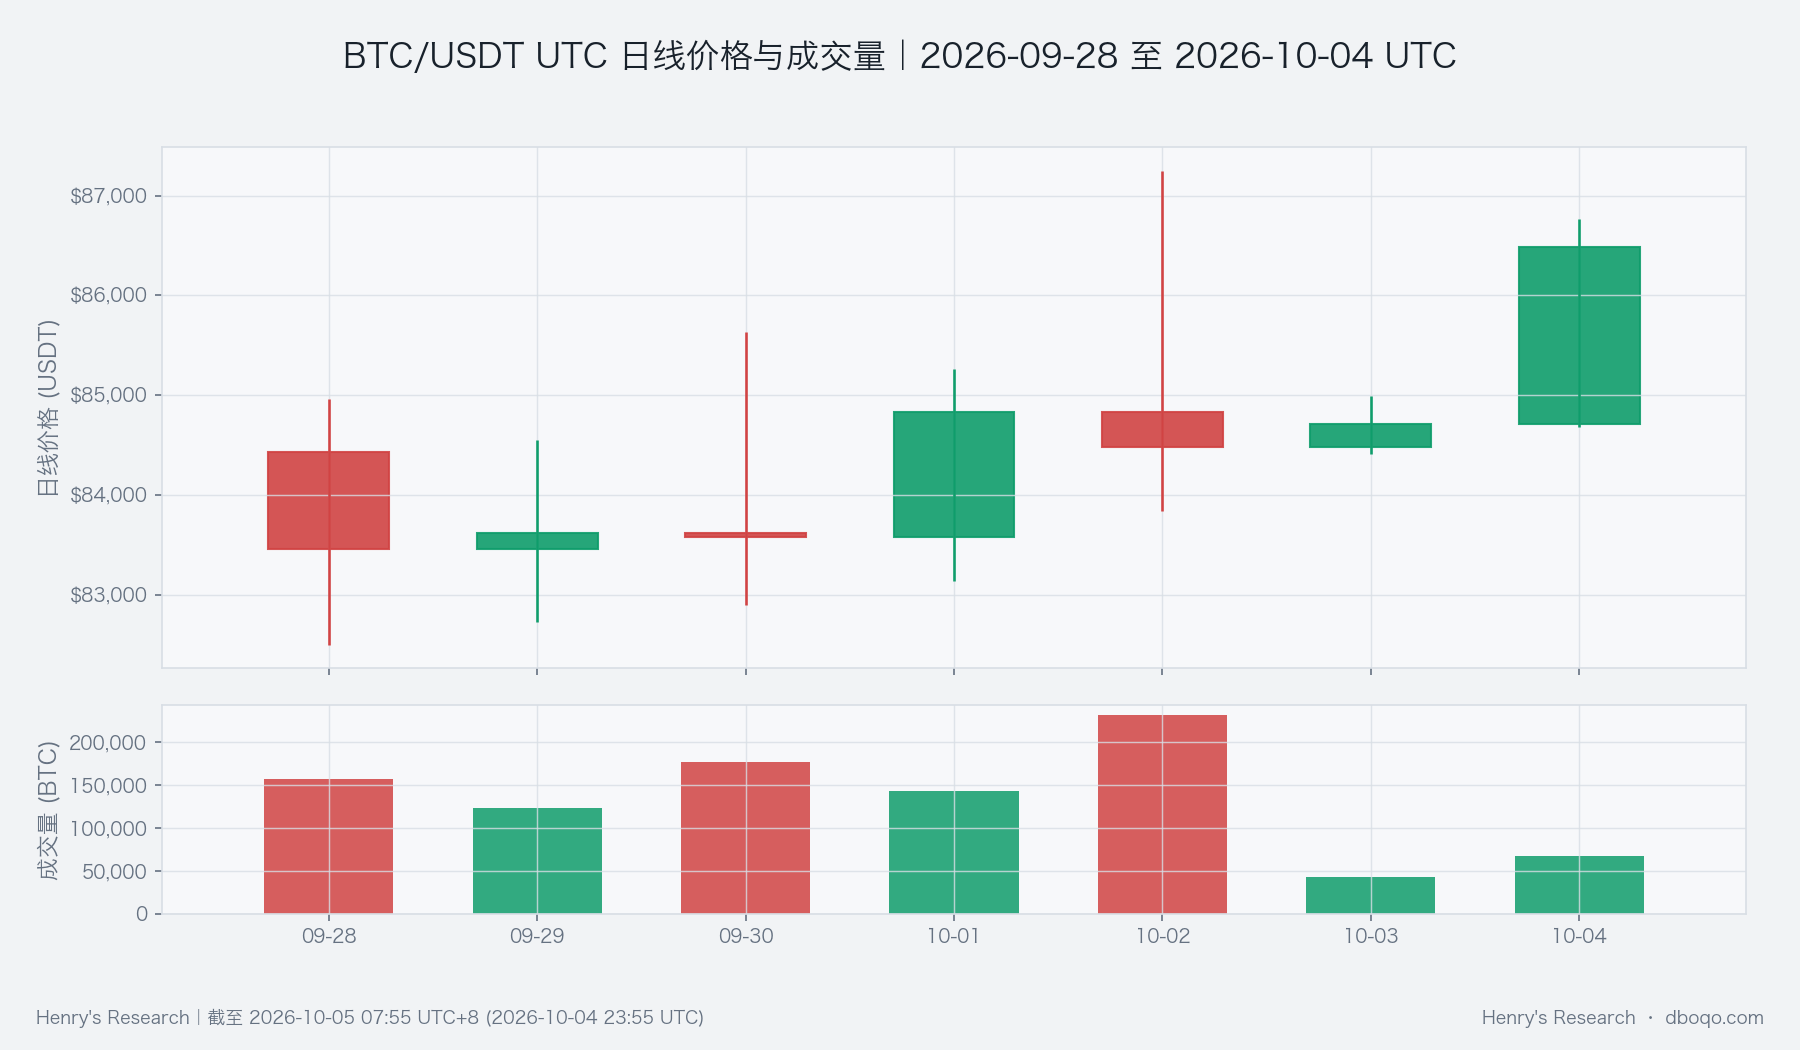
BTC rose last week, yet short-term stablecoin supply contracted. A range-bound market is therefore the more likely outcome next week. The week opened at 84,433.00 USDT, fell to 82,500.10 USDT early on, then recovered. A midweek push to 87,249.60 USDT faded before the price closed at 86,482.80 USDT. Buyers repaired the decline twice, but neither push established a lasting break higher. The open-to-close gain was 2.43%, a result for the full week rather than a steady seven-day climb.
Participation was the clearest limit on that rebound. Weekly volume was 942,738 BTC, below the 1,234,225 BTC historical mean across 104 comparable weeks and below roughly 73% of those weeks. Trading picked up on the midweek surge, then slowed sharply over the next two days even as price recovered into the weekend. Low volume does not mean the rebound must fail. It means another test of the upper range will need broader trading to show that buyers can absorb selling. The midweek reversal and later recovery are both visible in the price and volume chart.
Contracting stablecoin supply and a firm dollar restrain the advance
The funding backdrop was weaker than the price move. Seven-day stablecoin supply growth was -0.38%, against a historical mean of +0.50% across 104 comparable weeks. It was lower than roughly 88% of those weeks. Supply is a lagged measure of the available funding environment, not a direct count of BTC purchases. Still, the short-term contraction gives little evidence that fresh buying power has followed the rebound. Thirty-day growth remained positive at +0.38%, so the evidence points to a near-term slowdown rather than a wholesale retreat of longer-term funding.
The dollar index was relatively firm, ranking above roughly 87% of comparable weeks. BTC's thirty-day correlation with US equities was also above roughly 87% of those weeks. Both cross-market measures reflect rolling or lagged observations. They suggest that changes in broader risk sentiment may matter more for BTC, but do not establish that the dollar caused this week's price swings. Together with contracting short-term stablecoin supply, they explain why a higher weekly close alone is insufficient for a bullish call on next week.
Active buying improved, while trend confirmation stayed incomplete
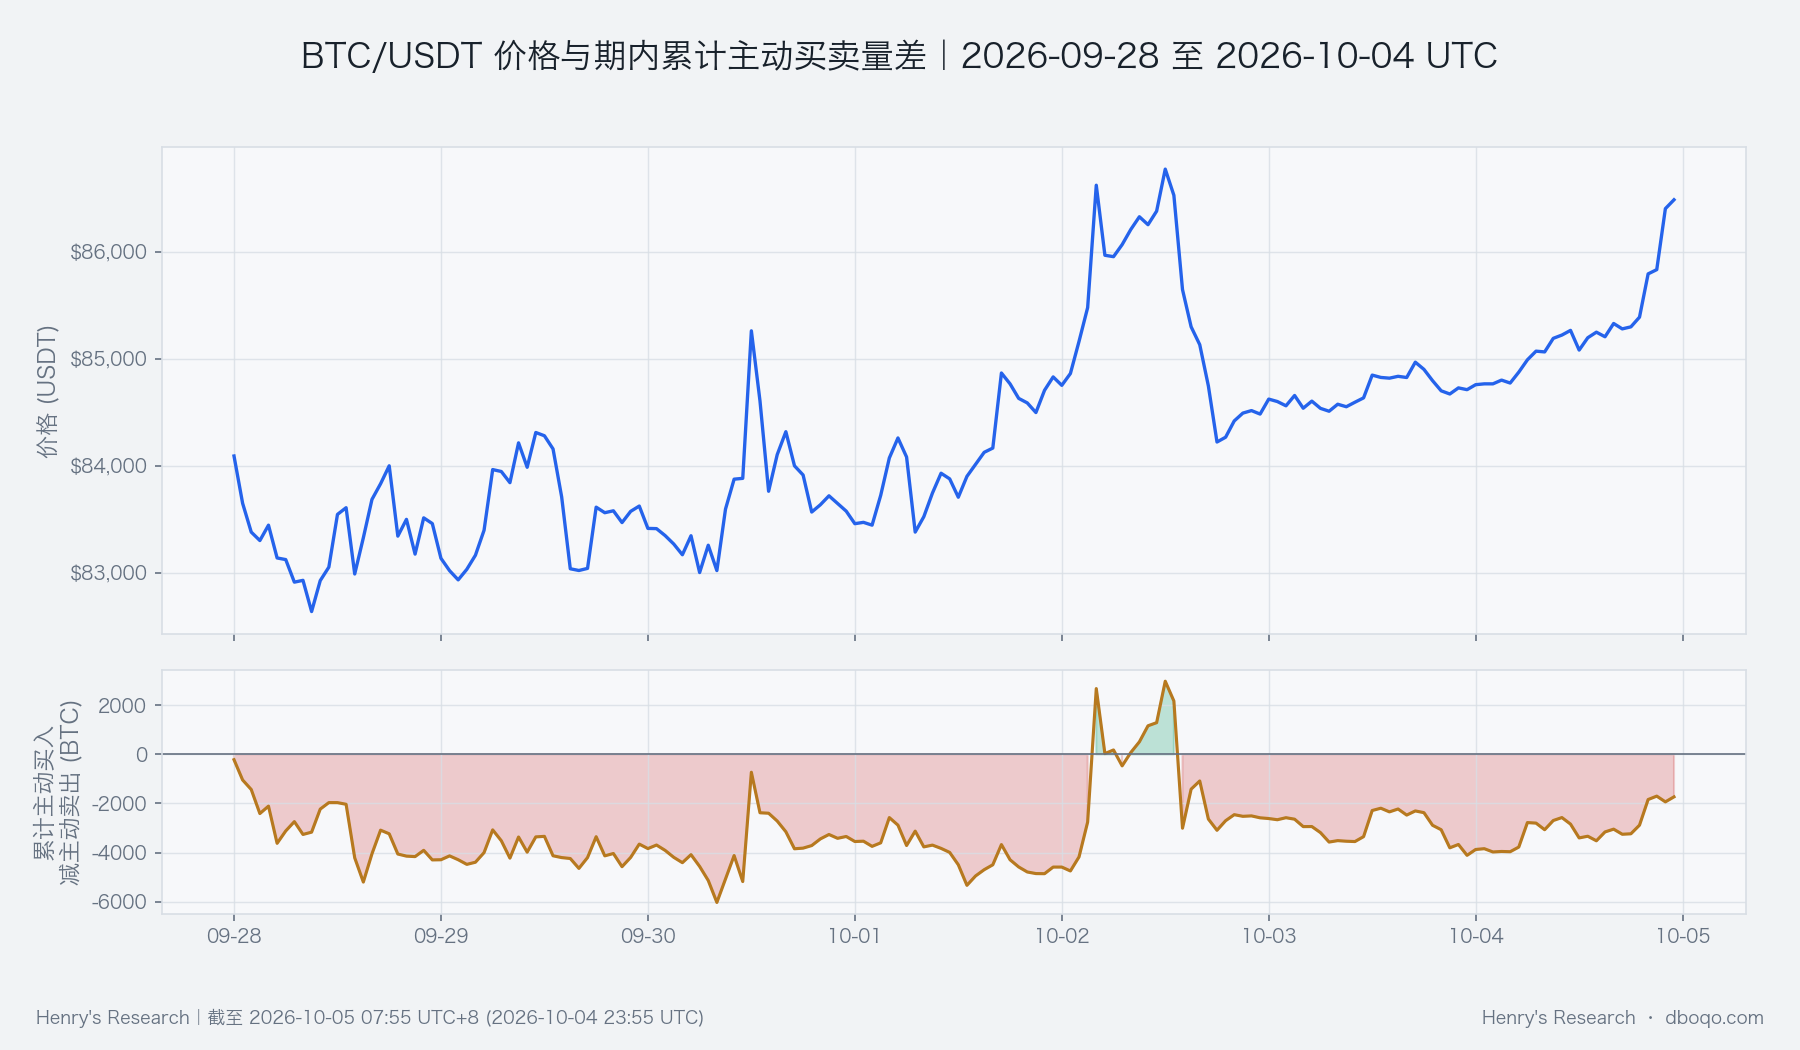
There is a meaningful counterpoint. The closing slope of cumulative aggressive buying minus selling was +22 BTC, above its historical mean of +3 BTC. Five-day ETF flows showed a net inflow of 8,360 ten-thousand US dollars. That ETF figure has a five-day window and observation lag; it is neither a full-week inflow nor a number to add to stablecoin supply. Buyers have not disappeared, and the joint recovery in price and active buying leaves room for another test higher.
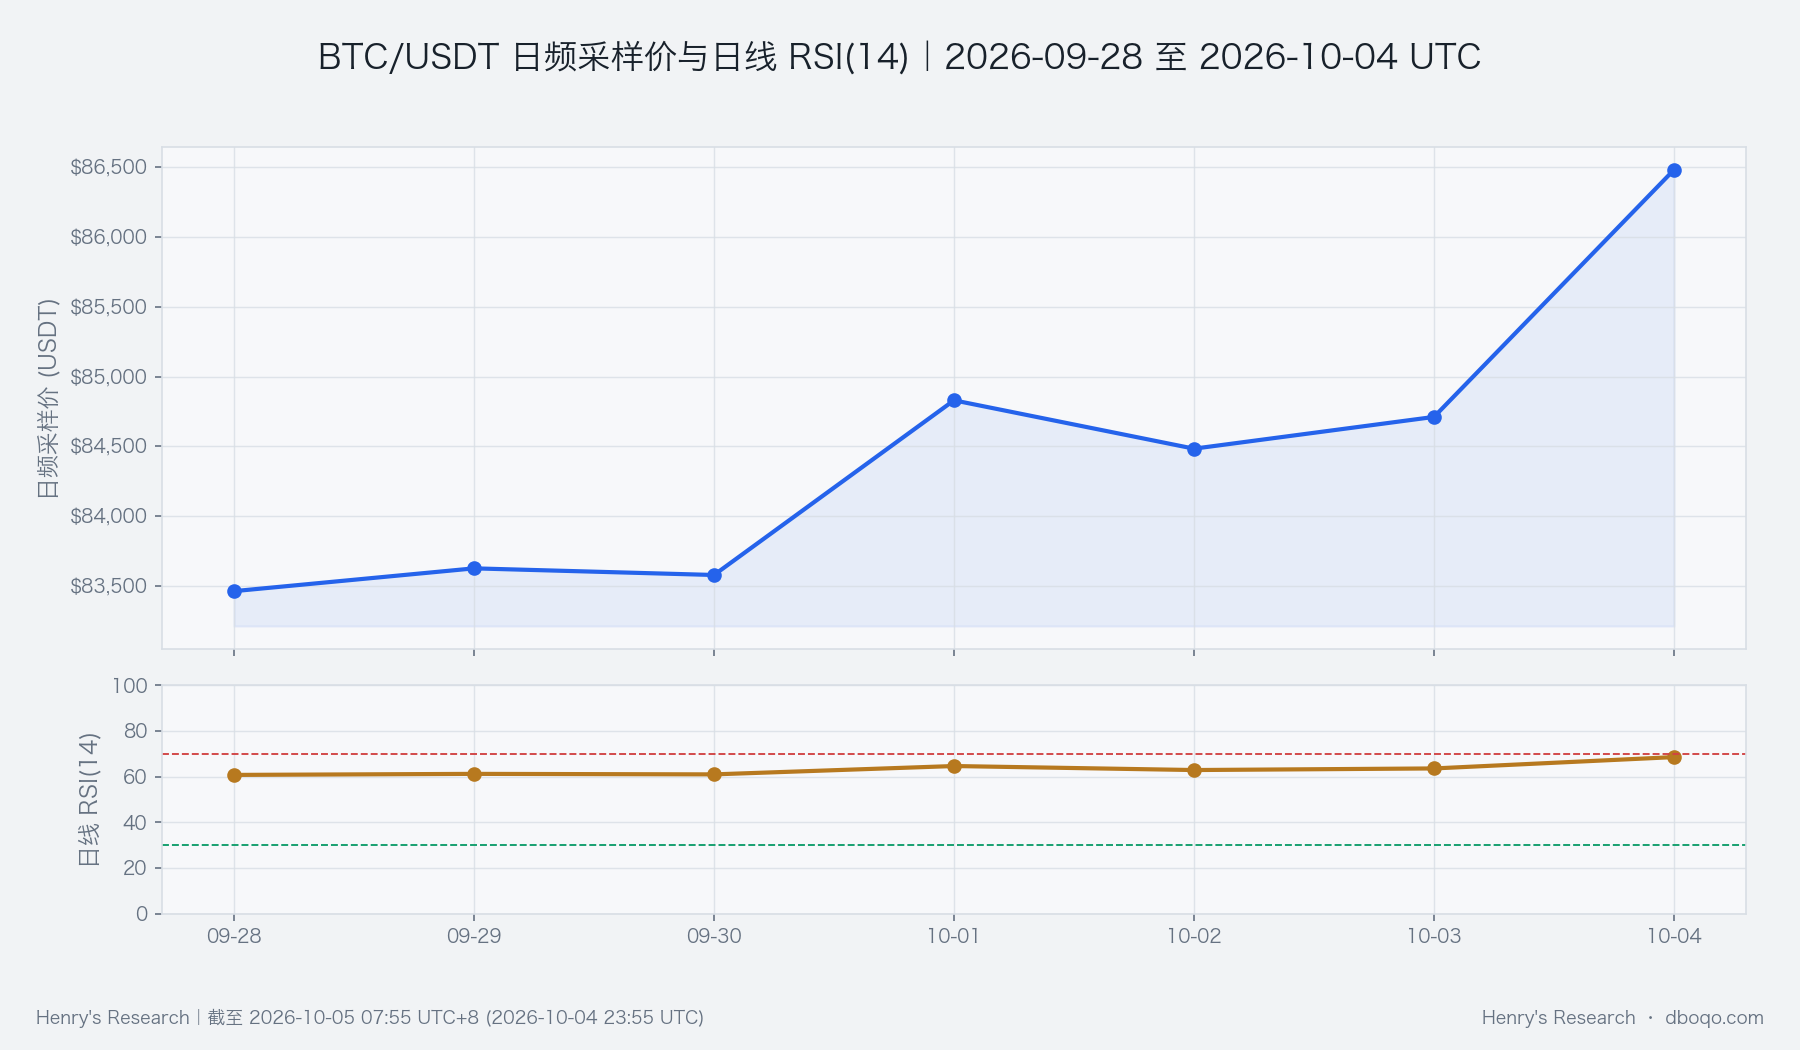
Yet the short moving-average spread was positive while the trend momentum histogram remained negative. The first shows recent prices above slightly older prices; the second says the pace of the advance is still uneven. The combined signal therefore did not confirm a one-way trend. The active buying chart shows improvement late in the week, but it must persist to turn a weekly rebound into a more durable rise. Taken together, the evidence supports a range-bound judgment better than any single strong reading does.
Next week hinges on whether funding catches up with price
First watch this week's high near 87,249.60 USDT. If price reclaims it as volume moves closer to its historical norm and short-term stablecoin supply stops contracting, the range-bound judgment needs reassessment. If the rebound instead loses participation again and breaks below this week's 82,500.10 USDT low, downside risk will rise. The key is whether price, trading and funding change together. A single crossing of either level would not establish a new trend.
Data note: The window is the full UTC week from 2026-9-28 00:00 to 10-5 00:00. Data end at 10-5 07:55 Beijing time. Historical comparisons use 104 complete comparable weeks. Funding and cross-market measures with different observation frequencies are conditional evidence.
Disclaimer: This report was prepared by dboqo using market data through 2026-10-05 07:55 UTC+8. Cryptocurrency markets are highly volatile. This report provides an objective analysis of market conditions only, does not constitute investment advice, and investors should assess risks and make decisions with care.